s
UNITED STATES
SECURITIES AND EXCHANGE COMMISSION
WASHINGTON, D.C. 20549
FORM 10-Q
(Mark One)
|
|
|
|
☒
|
QUARTERLY REPORT PURSUANT TO SECTION 13 OR 15(d) OF THE SECURITIES EXCHANGE ACT OF 1934
|
FOR THE QUARTERLY PERIOD ENDED MARCH 31, 2020
OR
|
|
|
|
☐
|
TRANSITION REPORT PURSUANT TO SECTION 13 OR 15(d) OF THE SECURITIES EXCHANGE ACT OF 1934
|
FOR THE TRANSITION PERIOD FROM TO
Commission File Number 0-29889
Rigel Pharmaceuticals, Inc.
(Exact name of registrant as specified in its charter)
|
|
|
|
|
Delaware
|
|
94-3248524
|
|
(State or other jurisdiction of incorporation or
|
|
(I.R.S. Employer Identification No.)
|
|
organization)
|
|
|
|
|
|
|
|
1180 Veterans Blvd.
|
|
|
|
South San Francisco, CA
|
|
94080
|
|
(Address of principal executive offices)
|
|
(Zip Code)
|
(650) 624-1100
(Registrant’s telephone number, including area code)
Securities registered pursuant to Section 12(b) of the Act:
|
|
|
|
|
|
|
Title of each class:
|
|
Trading Symbol
|
|
Name of each exchange on which registered:
|
|
Common Stock, par value $0.001 per share
|
|
RIGL
|
|
The Nasdaq Stock Market LLC
|
Indicate by check mark whether the registrant (1) has filed all reports required to be filed by Section 13 or 15(d) of the Securities Exchange Act of 1934 during the preceding 12 months (or for such shorter period that the registrant was required to file such reports), and (2) has been subject to such filing requirements for the past 90 days. Yes ☒ No ☐
Indicate by check mark whether the registrant has submitted electronically, every Interactive Data File required to be submitted pursuant to Rule 405 of Regulation S-T (§232.405 of this chapter) during the preceding 12 months (or for such shorter period that the registrant was required to submit such files). Yes ☒ No ☐
Indicate by check mark whether the registrant is a large accelerated filer, an accelerated filer, a non-accelerated filer, a smaller reporting company, or an emerging growth company. See the definitions of “large accelerated filer,” “accelerated filer,” “smaller reporting company,” and “emerging growth company” in Rule 12b-2 of the Exchange Act.
|
|
|
|
|
|
|
Large accelerated filer ☐
|
|
|
|
Accelerated filer ☒
|
|
Non-accelerated filer ☐
|
|
|
|
Smaller reporting company ☒
|
|
Emerging Growth Company ☐
|
|
|
|
|
If an emerging growth company, indicate by check mark if the registrant has elected not to use the extended transition period for complying with any new or revised financial accounting standards provided pursuant to Section 13(a) of the Exchange Act. ☐
Indicate by check mark whether the registrant is a shell company (as defined in Rule 12b-2 of the Exchange Act). Yes ☐ No ☒
As of May 1, 2020, there were 168,569,525 shares of the registrant’s Common Stock outstanding.
RIGEL PHARMACEUTICALS, INC.
QUARTERLY REPORT ON FORM 10-Q
FOR THE QUARTERLY PERIOD ENDED MARCH 31, 2020
INDEX
PART I. FINANCIAL INFORMATION
Item 1.Financial Statements
RIGEL PHARMACEUTICALS, INC.
CONDENSED BALANCE SHEETS
(In thousands)
|
|
|
|
|
|
|
|
|
|
|
|
March 31,
|
|
December 31,
|
|
|
|
|
2020
|
|
2019(1)
|
|
|
|
|
(unaudited)
|
|
|
|
|
|
Assets
|
|
|
|
|
|
|
|
|
Current assets:
|
|
|
|
|
|
|
|
|
Cash and cash equivalents
|
|
$
|
45,225
|
|
$
|
22,521
|
|
|
Short-term investments
|
|
|
50,701
|
|
|
75,557
|
|
|
Accounts receivable, net
|
|
|
9,660
|
|
|
10,111
|
|
|
Inventories
|
|
|
1,622
|
|
|
1,354
|
|
|
Prepaid and other current assets
|
|
|
9,124
|
|
|
9,462
|
|
|
Total current assets
|
|
|
116,332
|
|
|
119,005
|
|
|
Property and equipment, net
|
|
|
2,595
|
|
|
2,159
|
|
|
Operating lease right-of-use asset
|
|
|
23,775
|
|
|
25,709
|
|
|
Other assets
|
|
|
661
|
|
|
696
|
|
|
|
|
$
|
143,363
|
|
$
|
147,569
|
|
|
Liabilities and stockholders’ equity
|
|
|
|
|
|
|
|
|
Current liabilities:
|
|
|
|
|
|
|
|
|
Accounts payable
|
|
$
|
2,207
|
|
$
|
4,152
|
|
|
Accrued compensation
|
|
|
5,507
|
|
|
8,819
|
|
|
Accrued research and development
|
|
|
6,695
|
|
|
5,960
|
|
|
Other accrued liabilities
|
|
|
6,930
|
|
|
6,721
|
|
|
Lease liabilities, current portion
|
|
|
7,780
|
|
|
7,272
|
|
|
Deferred revenue, current portion
|
|
|
2,053
|
|
|
25,288
|
|
|
Total current liabilities
|
|
|
31,172
|
|
|
58,212
|
|
|
|
|
|
|
|
|
|
|
|
Long-term portion of deferred revenue
|
|
|
1,558
|
|
|
1,404
|
|
|
Long-term portion of lease liabilities
|
|
|
17,305
|
|
|
19,230
|
|
|
Loans payable, net of discount
|
|
|
9,829
|
|
|
9,810
|
|
|
Other long-term liabilities
|
|
|
5,000
|
|
|
5,098
|
|
|
|
|
|
|
|
|
|
|
|
Commitments
|
|
|
|
|
|
|
|
|
|
|
|
|
|
|
|
|
|
Stockholders’ equity:
|
|
|
|
|
|
|
|
|
Preferred stock
|
|
|
—
|
|
|
—
|
|
|
Common stock
|
|
|
169
|
|
|
168
|
|
|
Additional paid-in capital
|
|
|
1,333,237
|
|
|
1,329,852
|
|
|
Accumulated other comprehensive income
|
|
|
78
|
|
|
23
|
|
|
Accumulated deficit
|
|
|
(1,254,985)
|
|
|
(1,276,228)
|
|
|
Total stockholders’ equity
|
|
|
78,499
|
|
|
53,815
|
|
|
|
|
$
|
143,363
|
|
$
|
147,569
|
|
|
(1)
| |
The balance sheet at December 31, 2019 has been derived from the audited financial statements included in Rigel’s Annual Report on Form 10-K for the year ended December 31, 2019. |
See Accompanying Notes.
RIGEL PHARMACEUTICALS, INC.
CONDENSED STATEMENTS OF OPERATIONS
(In thousands, except per share amounts)
(unaudited)
|
|
|
|
|
|
|
|
|
|
|
|
|
Three Months Ended March 31,
|
|
|
|
|
|
2020
|
|
2019
|
|
|
|
Revenues:
|
|
|
|
|
|
|
|
|
|
Product sales, net
|
|
$
|
12,680
|
|
$
|
8,054
|
|
|
|
Contract revenues from collaborations
|
|
|
43,081
|
|
|
4,570
|
|
|
|
Total revenues
|
|
|
55,761
|
|
|
12,624
|
|
|
|
|
|
|
|
|
|
|
|
|
|
Costs and expenses:
|
|
|
|
|
|
|
|
|
|
Cost of product sales
|
|
|
155
|
|
|
107
|
|
|
|
Research and development
|
|
|
16,149
|
|
|
10,949
|
|
|
|
Selling, general and administrative
|
|
|
18,430
|
|
|
19,946
|
|
|
|
Total costs and expenses
|
|
|
34,734
|
|
|
31,002
|
|
|
|
|
|
|
|
|
|
|
|
|
|
Income (loss) from operations
|
|
|
21,027
|
|
|
(18,378)
|
|
|
|
Interest income
|
|
|
358
|
|
|
780
|
|
|
|
Interest expense
|
|
|
(142)
|
|
|
—
|
|
|
|
Net income (loss)
|
|
$
|
21,243
|
|
$
|
(17,598)
|
|
|
|
|
|
|
|
|
|
|
|
|
|
Net income (loss) per share, basic and diluted
|
|
|
|
|
|
|
|
|
|
Basic
|
|
$
|
0.13
|
|
$
|
(0.11)
|
|
|
|
Diluted
|
|
$
|
0.13
|
|
$
|
(0.11)
|
|
|
|
|
|
|
|
|
|
|
|
|
|
Weighted average shares used in computing net income (loss) per share
|
|
|
|
|
|
|
|
|
|
Basic
|
|
|
168,469
|
|
|
167,173
|
|
|
|
Diluted
|
|
|
168,568
|
|
|
167,173
|
|
|
See Accompanying Notes.
RIGEL PHARMACEUTICALS, INC.
CONDENSED STATEMENTS OF COMPREHENSIVE INCOME
(In thousands)
(unaudited)
|
|
|
|
|
|
|
|
|
|
|
|
|
Three Months Ended March 31,
|
|
|
|
|
|
2020
|
|
2019
|
|
|
|
Net income (loss)
|
|
$
|
21,243
|
|
$
|
(17,598)
|
|
|
|
Other comprehensive income:
|
|
|
|
|
|
|
|
|
|
Net unrealized gain on short-term investments
|
|
|
55
|
|
|
34
|
|
|
|
|
|
|
|
|
|
|
|
|
|
Comprehensive income (loss)
|
|
$
|
21,298
|
|
$
|
(17,564)
|
|
|
See Accompanying Notes.
RIGEL PHARMACEUTICALS, INC.
CONDENSED STATEMENTS OF STOCKHOLDERS’ EQUITY
(In thousands, except share amounts)
(unaudited)
|
|
|
|
|
|
|
|
|
|
|
|
|
|
|
|
|
|
|
|
|
|
|
|
|
|
|
|
|
|
Accumulated
|
|
|
|
|
|
|
|
|
|
|
|
|
|
|
Additional
|
|
Other
|
|
|
|
|
Total
|
|
|
|
Common Stock
|
|
Paid-in
|
|
Comprehensive
|
|
Accumulated
|
|
Stockholders’
|
|
|
|
Shares
|
|
Amount
|
|
Capital
|
|
Income
|
|
Deficit
|
|
Equity
|
|
Balance at December 31, 2019
|
|
167,987,850
|
|
$
|
168
|
|
$
|
1,329,852
|
|
$
|
23
|
|
$
|
(1,276,228)
|
|
$
|
53,815
|
|
Net income
|
|
—
|
|
|
—
|
|
|
—
|
|
|
—
|
|
|
21,243
|
|
|
21,243
|
|
Net unrealized gain on short-term investments
|
|
—
|
|
|
—
|
|
|
—
|
|
|
55
|
|
|
—
|
|
|
55
|
|
Issuance of common stock upon exercise of options
|
|
581,675
|
|
|
1
|
|
|
1,335
|
|
|
—
|
|
|
—
|
|
|
1,336
|
|
Stock compensation expense
|
|
—
|
|
|
—
|
|
|
2,050
|
|
|
—
|
|
|
—
|
|
|
2,050
|
|
Balance at March 31, 2020
|
|
168,569,525
|
|
$
|
169
|
|
$
|
1,333,237
|
|
$
|
78
|
|
$
|
(1,254,985)
|
|
$
|
78,499
|
|
|
|
|
|
|
|
|
|
|
|
|
|
|
|
|
|
|
|
|
|
|
|
|
|
|
|
|
|
|
Accumulated
|
|
|
|
|
|
|
|
|
|
|
|
|
|
|
Additional
|
|
Other
|
|
|
|
|
Total
|
|
|
|
Common Stock
|
|
Paid-in
|
|
Comprehensive
|
|
Accumulated
|
|
Stockholders’
|
|
|
|
Shares
|
|
Amount
|
|
Capital
|
|
Income (Loss)
|
|
Deficit
|
|
Equity
|
|
Balance at December 31, 2018
|
|
167,171,505
|
|
$
|
167
|
|
$
|
1,319,068
|
|
$
|
(24)
|
|
$
|
(1,209,334)
|
|
$
|
109,877
|
|
Net loss
|
|
—
|
|
|
—
|
|
|
—
|
|
|
—
|
|
|
(17,598)
|
|
|
(17,598)
|
|
Net unrealized gain on short-term investments
|
|
—
|
|
|
—
|
|
|
—
|
|
|
34
|
|
|
—
|
|
|
34
|
|
Issuance of common stock upon exercise of options
|
|
7,583
|
|
|
—
|
|
|
16
|
|
|
—
|
|
|
—
|
|
|
16
|
|
Stock compensation expense
|
|
—
|
|
|
—
|
|
|
2,986
|
|
|
—
|
|
|
—
|
|
|
2,986
|
|
Balance at March 31, 2019
|
|
167,179,088
|
|
$
|
167
|
|
$
|
1,322,070
|
|
$
|
10
|
|
$
|
(1,226,932)
|
|
$
|
95,315
|
RIGEL PHARMACEUTICALS, INC.
CONDENSED STATEMENTS OF CASH FLOWS
(In thousands)
(unaudited)
|
|
|
|
|
|
|
|
|
|
|
|
Three Months Ended March 31,
|
|
|
|
|
2020
|
|
2019
|
|
|
Operating activities
|
|
|
|
|
|
|
|
|
Net income (loss)
|
|
$
|
21,243
|
|
$
|
(17,598)
|
|
|
Adjustments to reconcile net income (loss) to net cash used in operating activities:
|
|
|
|
|
|
|
|
|
Stock-based compensation expense
|
|
|
2,024
|
|
|
2,953
|
|
|
Depreciation and amortization
|
|
|
171
|
|
|
164
|
|
|
Non-cash operating lease expense
|
|
|
1,934
|
|
|
1,691
|
|
|
Net amortization and accretion of discount on short-term investments and term loan
|
|
|
(138)
|
|
|
(282)
|
|
|
Changes in assets and liabilities:
|
|
|
|
|
|
|
|
|
Accounts receivable, net
|
|
|
451
|
|
|
(1,537)
|
|
|
Inventories
|
|
|
(242)
|
|
|
(203)
|
|
|
Prepaid and other current assets
|
|
|
338
|
|
|
(863)
|
|
|
Other assets
|
|
|
35
|
|
|
6
|
|
|
Accounts payable
|
|
|
(1,945)
|
|
|
(5,212)
|
|
|
Accrued compensation
|
|
|
(3,312)
|
|
|
(5,520)
|
|
|
Accrued research and development
|
|
|
735
|
|
|
236
|
|
|
Other accrued liabilities
|
|
|
209
|
|
|
1,642
|
|
|
Lease liability
|
|
|
(1,417)
|
|
|
(1,522)
|
|
|
Deferred revenue
|
|
|
(23,081)
|
|
|
25,476
|
|
|
Deferred rent and other long-term liabilities
|
|
|
(98)
|
|
|
—
|
|
|
Net cash used in operating activities
|
|
|
(3,093)
|
|
|
(569)
|
|
|
Investing activities
|
|
|
|
|
|
|
|
|
Purchases of short-term investments
|
|
|
(13,352)
|
|
|
(19,871)
|
|
|
Maturities of short-term investments
|
|
|
38,420
|
|
|
19,175
|
|
|
Capital expenditures
|
|
|
(607)
|
|
|
(377)
|
|
|
Net cash provided by (used in) investing activities
|
|
|
24,461
|
|
|
(1,073)
|
|
|
Financing activities
|
|
|
|
|
|
|
|
|
Net proceeds from issuances of common stock upon exercise of options and participation in Purchase Plan
|
|
|
1,336
|
|
|
16
|
|
|
Net cash provided by financing activities
|
|
|
1,336
|
|
|
16
|
|
|
Net increase (decrease) in cash and cash equivalents
|
|
|
22,704
|
|
|
(1,626)
|
|
|
Cash and cash equivalents at beginning of period
|
|
|
22,521
|
|
|
76,322
|
|
|
Cash and cash equivalents at end of period
|
|
$
|
45,225
|
|
$
|
74,696
|
|
|
Supplemental disclosure of cash flow information
|
|
|
|
|
|
|
|
|
Interest paid
|
|
$
|
203
|
|
$
|
—
|
|
|
|
|
|
|
|
|
|
|
See Accompanying Notes.
Rigel Pharmaceuticals, Inc.
Notes to Condensed Financial Statements
(unaudited)
In this report, “Rigel,” “we,” “us” and “our” refer to Rigel Pharmaceuticals, Inc.
1.Nature of Operations
We are a biotechnology company dedicated to discovering, developing and providing novel small molecule drugs that significantly improve the lives of patients with immune and hematologic disorders, cancer and rare diseases. Our pioneering research focuses on signaling pathways that are critical to disease mechanisms. Our first U.S. Food and Drug Administration (FDA) approved product is TAVALISSE® (fostamatinib disodium hexahydrate), the only oral spleen tyrosine kinase (SYK) inhibitor, for the treatment of adult patients with chronic immune thrombocytopenia (ITP) who have had an insufficient response to a previous treatment. The marketing authorization application (MAA) for fostamatinib was approved by the European Commission (EC) in Europe in January 2020 for the treatment of chronic ITP in adult patients who are refractory to other treatments, and will be marketed in Europe under the name TAVLESSE® (fostamatinib). Our clinical programs include a Phase 3 study of fostamatinib in warm autoimmune hemolytic anemia (AIHA); a completed Phase 1 study of R835, a proprietary molecule from our interleukin receptor associated kinase (IRAK 1/4) inhibitor program; and an ongoing Phase 1 study of R552, a proprietary molecule from our receptor-interacting protein kinase (RIP1) inhibitor program. In addition, we have product candidates in clinical development with partners BerGenBio ASA (BerGenBio), Daiichi Sankyo (Daiichi), Aclaris Therapeutics (Aclaris), and AstraZeneca AB (AZ).
2.Basis of Presentation
Our accompanying unaudited condensed financial statements have been prepared in accordance with U.S. generally accepted accounting principles (U.S. GAAP), for interim financial information and pursuant to the instructions to Form 10-Q and Article 10 of Regulation S-X of the Securities Act of 1933, as amended (Securities Act). Accordingly, they do not include all the information and notes required by U.S. GAAP for complete financial statements. These unaudited condensed financial statements include only normal and recurring adjustments that we believe are necessary to fairly state our financial position and the results of our operations and cash flows. Interim-period results are not necessarily indicative of results of operations or cash flows for a full-year or any subsequent interim period. The balance sheet at December 31, 2019 has been derived from audited financial statements at that date but does not include all disclosures required by U.S. GAAP for complete financial statements. Because certain disclosures required by U.S. GAAP for complete financial statements are not included herein, these interim unaudited condensed financial statements and the notes accompanying them should be read in conjunction with our audited financial statements and the notes thereto included in our Annual Report on Form 10-K for the year ended December 31, 2019.
The preparation of financial statements in conformity with U.S. GAAP requires management to make estimates and assumptions that affect the amounts reported in the financial statements and accompanying notes. We base our estimates on historical experience and on various other assumptions that we believe to be reasonable under the circumstances. Actual results could differ from these estimates.
3.Summary of Significant Accounting Policies
Recent Accounting Pronouncements
In June 2016, the FASB issued ASU 2016-13—Financial Instruments – Credit Losses (Topic 326): Measurement of Credit Losses on Financial Instruments, which represents a new credit loss standard that will change the impairment model for most financial assets and certain other financial instruments. Specifically, this guidance will require entities to utilize a new “expected loss” model as it relates to trade and other receivables. In addition, entities will be required to recognize an allowance for estimated credit losses on available-for-sale debt securities, regardless of the length of time that a security has been in an unrealized loss position. This guidance will be effective for annual
reporting periods beginning after December 15, 2019, including interim periods within those annual reporting periods. We adopted this new standard on January 1, 2020 with no material impact on our financial statements and related disclosures.
In August 2018, the FASB issued ASU 2018-13—Fair Value Measurement (Topic 820): Disclosure Framework-Changes to the Disclosure Requirements for Fair Value Measurement (ASU 2018-13), which modifies the disclosure requirements on fair value measurements. This guidance is effective for fiscal years beginning after December 15, 2019, and interim periods therein. We adopted this new standard on January 1, 2020 with no material impact on our financial statements and related disclosures.
In November 2018, the FASB issued ASU 2018-18—Collaborative Arrangements (Topic 808): Clarifying the Interaction between Topic 808 and Topic 606. This standard provides guidance on the interaction between Revenue Recognition (Topic 606) and Collaborative Arrangements (Topic 808) by aligning the unit of account guidance between the two topics and clarifying whether certain transactions between collaborative participants should be accounted for as revenue under Topic 606. ASU 2018-18 is effective for fiscal years beginning after December 15, 2019, and interim periods within those fiscal years. We adopted this new standard on January 1, 2020 with no material impact on our financial statements and related disclosures.
Inventories
Inventories are stated at the lower of cost or estimated net realizable value. We determine the cost of inventories using the standard cost method, which approximates actual cost based on a first-in, first out basis. Inventories consist primarily of third-party manufacturing costs and allocated internal overhead costs. We began capitalizing inventory costs associated with our product upon regulatory approval when, based on management’s judgment, future commercialization was considered probable and the future economic benefit was expected to be realized.
Prior to FDA approval of TAVALISSE, all manufacturing costs were charged to research and development expense in the period incurred. At March 31, 2020 and December 31, 2019, our physical inventory included active pharmaceutical product of which costs have been previously charged to research and development expense. However, manufacturing of drug product, finished bottling and other labeling activities that occurred post FDA approval are included in the inventory value at each balance sheet date.
We provide reserves for potential excess, dated or obsolete inventories based on an analysis of forecasted demand compared to quantities on hand and any firm purchase orders, as well as product shelf life.
Cost of Product Sales
Cost of product sales consists of third-party manufacturing costs, transportation and freight, and indirect overhead costs associated with the manufacture and distribution of TAVALISSE. A portion of the cost of producing the product sold to date was expensed as research and development prior to the Company’s New Drug Application (NDA) approval for TAVALISSE and therefore is not included in the cost of product sales during this period.
Accounts Receivable
Accounts receivable are recorded net of customer allowances for prompt payment discounts and any allowance for doubtful accounts. We estimate the allowance for doubtful accounts based on existing contractual payment terms, actual payment patterns of our customers and individual customer circumstances. To date, we have determined that an allowance for doubtful accounts is not required.
Revenue Recognition
We recognize revenue in accordance with ASC Topic 606, Revenue From Contracts with Customers (ASC 606), when our customer obtains control of promised goods or services, in an amount that reflects the consideration
which we expect to receive in exchange for those goods or services. To determine whether arrangements are within the scope of ASC 606, we perform the following five steps: (i) identify the contract(s) with a customer; (ii) identify the performance obligations in the contract; (iii) determine the transaction price; (iv) allocate the transaction price to the performance obligations in the contract; and (v) recognize revenue when (or as) the Company satisfies its performance obligation. We apply the five-step model to contracts when it is probable that we will collect the consideration we are entitled to in exchange for the goods or services we transfer to the customer. At contract inception, once the contract is determined to be within the scope of this new guidance, we assess the goods or services promised within each contract and identify, as a performance obligation, and assess whether each promised good or service is distinct. We then recognize as revenue the amount of the transaction price that is allocated to the respective performance obligation when (or as) the performance obligation is satisfied.
Product Sales
Revenues from product sales are recognized when the specialty distributors (SDs), who are our customers, obtain control of our product, which occurs at a point in time, upon delivery to such SDs. These SDs subsequently resell our products to specialty pharmacy providers, health care providers, hospitals and clinics. In addition to distribution agreements with these SDs, we also enter into arrangements with specialty pharmacy providers, in-office dispensing providers, group purchasing organizations, and government entities that provide for government-mandated and/or privately-negotiated rebates, chargebacks and discounts with respect to the purchase of our products.
Under ASC 606, we are required to estimate the transaction price, including variable consideration that is subject to a constraint, in our contracts with our customers. Variable consideration is included in the transaction price to the extent that it is probable that a significant reversal in the amount of cumulative revenue recognized will not occur. Revenue from product sales are recorded net of certain variable consideration which includes estimated government-mandated rebates and chargebacks, distribution fees, estimated product returns and other deductions.
Provisions for returns and other adjustments are provided for in the period the related revenue is recorded. Actual amounts of consideration ultimately received may differ from our estimates. If actual results in the future vary from our estimates, we will adjust these estimates, which would affect net product revenue and earnings in the period such variances become known.
The following are our significant categories of sales discounts and allowances:
Sales Discounts. We provide our customers prompt payment discounts that are explicitly stated in our contracts and are recorded as a reduction of revenue in the period the related product revenue is recognized.
Product Returns. We offer our SDs a right to return product purchased directly from us, which is principally based upon the product’s expiration date. Product return allowances are estimated and recorded at the time of sale.
Government Rebates: We are subject to discount obligations under the state Medicaid programs and Medicare prescription drug coverage gap program. We estimate our Medicaid and Medicare prescription drug coverage gap rebates based upon a range of possible outcomes that are probability-weighted for the estimated payor mix. These reserves are recorded in the same period the related revenue is recognized, resulting in a reduction of product revenue and the establishment of a current liability that is included as part of Other Accrued Liabilities account in the Balance Sheet. Our liability for these rebates consists primarily of estimates of claims for the current quarter, and estimated future claims that will be made for product that has been recognized as revenue, but remains in the distribution channel inventories at the end of each reporting period.
Chargebacks and Discounts: Chargebacks for fees and discounts represent the estimated obligations resulting from contractual commitments to sell products to certain specialty pharmacy providers, in-office dispensing providers, group purchasing organizations, and government entities at prices lower than the list prices charged to our SDs who directly purchase the product from us. These SDs charge us for the difference between what they pay for the product and our contracted selling price to these specialty pharmacy providers, in-office dispensing providers, group purchasing
organizations, and government entities. These reserves are established in the same period that the related revenue is recognized, resulting in a reduction of product revenue. Actual chargeback amounts are generally determined at the time of resale to the specialty pharmacy providers, in-office dispensing providers, group purchasing organizations, and government entities by our SDs. The estimated obligations arising from these chargebacks and discounts are included as part of Other Accrued Liabilities in the balance sheet.
Co-Payment Assistance: We offer co-payment assistance to commercially insured patients meeting certain eligibility requirements. The calculation of the accrual for co-pay assistance is based on an estimate of claims and the cost per claim that we expect to receive associated with product that has been recognized as revenue.
Contract Revenues from Collaborations
In the normal course of business, we conduct research and development programs independently and in connection with our corporate collaborators, pursuant to which we license certain rights to our intellectual property to third parties. The terms of these arrangements typically include payment to us for a combination of one or more of the following: upfront license fees; development, regulatory and commercial milestone payments; product supply services; and royalties on net sales of licensed products.
Upfront License Fees: If the license to our intellectual property is determined to be distinct from the other performance obligations identified in the arrangement, we recognize revenues from upfront license fees allocated to the license when the license is transferred to the licensee and the licensee is able to use and benefit from the license. For licenses that are bundled with other promises, we determine whether the combined performance obligation is satisfied over time or at a point in time. If the combined performance obligation is satisfied over time, we use judgment in determining the appropriate method of measuring progress for purposes of recognizing revenue from the up-front license fees. We evaluate the measure of progress each reporting period and, if necessary, adjust the measure of performance and related revenue recognition.
Development, Regulatory or Commercial Milestone Payments: At the inception of each arrangement that includes payments based on the achievement of certain development, regulatory and commercial or launch events, we evaluate whether the milestones are considered probable of being achieved and estimate the amount to be included in the transaction price using the most likely amount method. If it is probable that a significant revenue reversal would not occur, the associated milestone value is included in the transaction price. Milestone payments that are not within our or the licensee’s control, such as regulatory approvals, are not considered probable of being achieved until uncertainty associated with the approvals has been resolved. The transaction price is then allocated to each performance obligation, on a relative standalone selling price basis, for which we recognize revenue as or when the performance obligations under the contract are satisfied. At the end of each subsequent reporting period, we re-evaluate the probability of achieving such development and regulatory milestones and any related constraint, and if necessary, adjust our estimate of the overall transaction price. Any such adjustments are recorded on a cumulative catch-up basis, and recorded as part of contract revenues from collaborations during the period of adjustment.
Product Supply Services: Arrangements that include a promise for future supply of drug product for either clinical development or commercial supply at the licensee’s discretion are generally considered as options. We assess if these options provide a material right to the licensee and if so, they are accounted for as separate performance obligations.
Sales-based Milestone Payments and Royalties: For arrangements that include sales-based royalties, including milestone payments based on the volume of sales, we determine whether the license is deemed to be the predominant item to which the royalties or sales-based milestones relate to and if such is the case, we recognize revenue at the later of (i) when the related sales occur, or (ii) when the performance obligation to which some or all of the royalty has been allocated has been satisfied (or partially satisfied).
Leases
We currently lease our research and office space under a noncancelable lease agreement with our landlord through January 2023. In December 2014, we entered into a sublease agreement with an unrelated third party to occupy a portion of our research and office space through January 2023.
All of our leases outstanding as of March 31, 2020 continued to be classified as operating leases. We recorded an operating lease right-of-use asset and an operating lease liability on our balance sheet. Right-of-use lease assets represent our right to use the underlying asset for the lease term and the lease obligation represents our commitment to make the lease payments arising from the lease. Right-of-use lease assets and obligations are recognized at the commencement date based on the present value of remaining lease payments over the lease term. As our lease does not provide an implicit rate, we have used an estimated incremental borrowing rate based on the information available at the commencement date in determining the present value of lease payments. The operating lease right-of-use asset includes any lease payments made prior to commencement. The lease term may include options to extend or terminate the lease when it is reasonably certain that we will exercise that option. Operating lease expense is recognized on a straight-line basis over the lease term, subject to any changes in the lease or expectations regarding the terms. Variable lease costs such as common area costs and property taxes are expensed as incurred. Leases with an initial term of 12 months or less are not recorded on the balance sheet.
For our sublease agreement wherein we are the lessor, sublease income will be recognized on a straight-line basis over the term of the sublease. The difference between the cash received, and the straight-line lease income recognized, if any, will be recorded as part of prepaid and other current assets in the balance sheet.
Research and Development Accruals
We have various contracts with third parties related to our research and development activities. Costs that are incurred but not billed to us as of the end of the period are accrued. We make estimates of the amounts incurred in each period based on the information available to us and our knowledge of the nature of the contractual activities generating such costs. Clinical trial contract expenses are accrued based on units of activity. Expenses related to other research and development contracts, such as research contracts, toxicology study contracts and manufacturing contracts are estimated to be incurred generally on a straight-line basis over the duration of the contracts. Raw materials and study materials not related to our approved drug, purchased for us by third parties are expensed at the time of purchase.
Income Taxes
Income taxes have been provided using the liability method whereby deferred tax assets and liabilities are determined based on differences between financial reporting and tax bases of assets and liabilities and net operating loss and tax credit carryforwards measured using the enacted tax rates and laws that will be in effect when the differences are expected to reverse or the carryforwards are utilized. Valuation allowances are established when it is determined that it is more likely than not that such assets will not be realized.
We account for uncertain tax positions consistent with authoritative guidance. The guidance prescribes a “more likely than not” recognition threshold and measurement attribute for the financial statement recognition and measurement of a tax position taken or expected to be taken in a tax return. We do not expect any material change in our unrecognized tax benefits over the next twelve months. We recognize interest and penalties related to unrecognized tax benefits as a component of income taxes.
On March 27, 2020, the Coronavirus Aid, Relief and Economic Security (CARES) Act was signed into law. The Act includes provisions relating to refundable payroll tax credits, deferment of the employer portion of certain payroll taxes, net operating loss carryback periods, alternative minimum tax credit refunds, modifications to the net interest deduction limitations and technical corrections to tax depreciation methods for qualified improvement property. We are currently analyzing the impact of these changes and therefore an estimate of the impact to income taxes is not yet
available. While we continue to evaluate the impact of the CARES Act, we do not currently believe it will have a material impact on our financial statements or related disclosures.
4. Stock Award Plans
On May 16, 2018, our stockholders approved the adoption of the Company’s 2018 Equity Incentive Plan (2018 Plan). The 2018 Plan is the successor plan to the 2011 Equity Incentive Plan, the 2000 Equity Incentive Plan, and the 2000 Non-Employee Directors' Stock Option Plan.
To date, we have two stock option plans, our 2018 Plan and the Inducement Plan (collectively, the Equity Incentive Plans), that provide for granting to our officers, directors and all other employees and consultants options to purchase shares of our common stock. We also have our Employee Stock Purchase Plan (Purchase Plan), wherein eligible employees can purchase shares of our common stock at a price per share equal to the lesser of 85% of the fair market value on the first day of the offering period or 85% of the fair market value on the purchase date. The fair value of each option award is estimated on the date of grant using the Black-Scholes option pricing model which considered our stock price, as well as assumptions regarding a number of complex and subjective variables. These variables include, but are not limited to, volatility, expected term, risk-free interest rate and dividends. We estimate volatility over the expected term of the option using historical share price performance. For expected term, we take into consideration our historical data of options exercised, cancelled and expired. The risk-free rate is based on the U.S. Treasury constant maturity rate. We have not paid and do not expect to pay dividends in the foreseeable future. We use the straight-line attribution method over the requisite employee service period for the entire award in recognizing stock-based compensation expense. We account for forfeitures as they occur.
We granted performance-based stock options to purchase shares of our common stock which will vest upon the achievement of certain corporate performance-based milestones. We determined the fair values of these performance-based stock options using the Black-Scholes option pricing model at the date of grant. For the portion of the performance-based stock options of which the performance condition is considered probable of achievement, we recognize stock-based compensation expense on the related estimated grant date fair values of such options on a straight-line basis from the date of grant up to the date when we expect the performance condition will be achieved. For the performance conditions that are not considered probable of achievement at the grant date or upon quarterly re-evaluation, prior to the event actually occurring, we recognize the related stock-based compensation expense when the event occurs or when we can determine that the performance condition is probable of achievement. In those cases, we recognize the change in estimate at the time we determine the condition is probable of achievement (by recognizing stock-based compensation expense as cumulative catch-up adjustment as if we had estimated at the grant date that the performance condition would have been achieved) and recognize the remaining compensation cost up to the date when we expect the performance condition will be achieved, if any.
5.Earnings (Loss) Per Share
Basic earnings (loss) per share is computed by dividing net income (loss) by the weighted‑average number of shares of common stock outstanding during the period. Diluted earnings (loss) per share is computed by dividing net income (loss) by the weighted‑average number of shares of common stock outstanding during the period and the number of additional shares of common stock that would have been outstanding if potentially dilutive securities had been issued. Potentially dilutive securities include warrant and stock options and shares issuable under our Purchase Plan. The dilutive effect of these potentially dilutive securities is reflected in diluted earnings per share by application of the treasury stock method. Under the treasury stock method, an increase in the fair market value of our common stock can result in a greater dilutive effect from potentially dilutive securities.
The following table sets forth the computation of basic and diluted earnings per share (in thousands except per share amounts):
|
|
|
|
|
|
|
|
|
|
|
|
|
Three Months Ended
|
|
|
|
|
|
March 31,
|
|
|
|
|
|
2020
|
|
2019
|
|
|
|
EPS Numerator:
|
|
|
|
|
|
|
|
|
|
Net income (loss)
|
|
$
|
21,243
|
|
$
|
(17,598)
|
|
|
|
EPS Denominator—Basic:
|
|
|
|
|
|
|
|
|
|
Weighted-average common shares outstanding
|
|
|
168,469
|
|
|
167,173
|
|
|
|
EPS Denominator—Diluted:
|
|
|
|
|
|
|
|
|
|
Weighted-average common shares outstanding
|
|
|
168,469
|
|
|
167,173
|
|
|
|
Dilutive effect of stock options, shares under ESPP and warrant
|
|
|
99
|
|
|
—
|
|
|
|
Weighted-average shares outstanding and common stock equivalents
|
|
|
168,568
|
|
|
167,173
|
|
|
|
Net income (loss) per common share:
|
|
|
|
|
|
|
|
|
|
Basic
|
|
$
|
0.13
|
|
$
|
(0.11)
|
|
|
|
Diluted
|
|
$
|
0.13
|
|
$
|
(0.11)
|
|
|
We had securities which could potentially dilute basic earnings per share, but were excluded from the computation of diluted earnings (loss) per share for all periods presented, as their effect would have been antidilutive. These securities consist of the following (in thousands):
|
|
|
|
|
|
|
|
|
|
|
|
|
|
Three Months Ended
|
|
|
|
|
|
|
March 31,
|
|
|
|
|
|
|
2020
|
|
2019
|
|
|
|
|
Outstanding stock options
|
|
|
23,206
|
|
|
25,126
|
|
|
|
|
Purchase Plan
|
|
|
—
|
|
|
130
|
|
|
|
|
Total
|
|
|
23,206
|
|
|
25,256
|
|
|
|
6.Stock-Based Compensation
Total stock-based compensation related to all of our share-based payments that we recognized for the three months ended March 31, 2020 and 2019 were as follows (in thousands):
|
|
|
|
|
|
|
|
|
|
|
|
|
Three Months Ended
|
|
|
|
|
|
March 31,
|
|
|
|
|
|
2020
|
|
2019
|
|
|
|
Selling, general and administrative
|
|
$
|
1,330
|
|
$
|
2,166
|
|
|
|
Research and development
|
|
|
694
|
|
|
787
|
|
|
|
Total stock-based compensation expense
|
|
$
|
2,024
|
|
$
|
2,953
|
|
|
The fair value of each option award is estimated on the date of grant using the Black-Scholes option pricing model. We have segregated option awards into the following three homogenous groups for the purposes of determining fair values of options: officers and directors, all other employees, and consultants. We account for forfeitures as they occur.
We determined weighted-average valuation assumptions separately for each of these groups as follows:
|
·
| |
Volatility—We estimated volatility using our historical share price performance over the expected life of the option. We also considered other factors, such as implied volatility, our current clinical trials and other company activities that may affect the volatility of our stock in the future. We determined that at this time historical volatility is more indicative of our expected future stock performance than implied volatility. |
|
·
| |
Expected term—For options granted to consultants, we use the contractual term of the option, which is generally ten years, for the initial valuation of the option and the remaining contractual term of the |
option for the succeeding periods. We analyzed various historical data to determine the applicable expected term for each of the other option groups. This data included: (1) for exercised options, the term of the options from option grant date to exercise date; (2) for cancelled options, the term of the options from option grant date to cancellation date, excluding non-vested option forfeitures; and (3) for options that remained outstanding at the balance sheet date, the term of the options from option grant date to the end of the reporting period and the estimated remaining term of the options. The consideration and calculation of the above data gave us reasonable estimates of the expected term for each employee group. We also considered the vesting schedules of the options granted and factors surrounding exercise behavior of the option groups, our current market price and company activity that may affect our market price. In addition, we considered the optionee type (i.e., officers and directors or all other employees) and other factors that may affect the expected term of the options. |
|
·
| |
Risk-free interest rate—The risk-free interest rate is based on U.S. Treasury constant maturity rates with similar terms to the expected term of the options for each option group. |
|
·
| |
Dividend yield—The expected dividend yield is 0% as we have not paid and do not expect to pay dividends in the future. |
The following table summarizes the weighted-average assumptions relating to options granted pursuant to our equity incentive plans for the three months ended March 31, 2020 and 2019:
|
|
|
|
|
|
|
|
|
|
|
|
Three Months Ended
|
|
|
|
|
|
|
March 31,
|
|
|
|
|
|
|
2020
|
|
2019
|
|
|
|
|
Risk-free interest rate
|
|
1.3
|
%
|
2.6
|
%
|
|
|
|
Expected term (in years)
|
|
6.5
|
|
6.6
|
|
|
|
|
Dividend yield
|
|
0.0
|
%
|
0.0
|
%
|
|
|
|
Expected volatility
|
|
65.4
|
%
|
65.9
|
%
|
|
|
The exercise price of stock options granted under our stock plans is equal to the fair market value of the underlying shares on the date of grant. Options become exercisable at varying dates and generally expire 10 years from the date of grant.
We granted options to purchase 6,147,290 shares of common stock during the three months ended March 31, 2020 with a grant-date weighted-average fair value of $1.45 per share. As of March 31, 2020, we had 776,250 shares of outstanding performance-based stock options wherein the achievement of the corresponding corporate-based milestones was not considered as probable. Accordingly, none of the stock-based compensation expense of $1.2 million has been recognized as expense as of March 31, 2020.
As of March 31, 2020, there were approximately $14.8 million of unrecognized stock-based compensation cost related to time-based stock options and performance-based stock options, wherein achievement of the corresponding corporate-based milestones was considered as probable.
At March 31, 2020, there were 11,291,451 shares of common stock available for future grant under our equity incentive plans and 581,675 options to purchase shares were exercised during the three months ended March 31, 2020.
Employee Stock Purchase Plan
Our Purchase Plan permits eligible employees to purchase common stock at a discount through payroll deductions during defined offering periods. The price at which the stock is purchased is equal to the lesser of 85% of the
fair market value of our common stock on the first day of the offering or 85% of the fair market value of our common stock on the purchase date. The initial offering period commenced on the effective date of our initial public offering.
The fair value of awards granted under our Purchase Plan is estimated on the date of grant using the Black-Scholes option pricing model, which uses weighted-average assumptions. Our Purchase Plan provides for a twenty-four-month offering period comprised of four six-month purchase periods with a look-back option. A look-back option is a provision in our Purchase Plan under which eligible employees can purchase shares of our common stock at a price per share equal to the lesser of 85% of the fair market value on the first day of the offering period or 85% of the fair market value on the purchase date. Our Purchase Plan also includes a feature that provides for a new offering period to begin when the fair market value of our common stock on any purchase date during an offering period falls below the fair market value of our common stock on the first day of such offering period. This feature is called a “reset.” Participants are automatically enrolled in the new offering period. We had a “reset” on January 2, 2020 because the fair market value of our stock on December 31, 2019 was lower than the fair market value of our stock on January 1, 2019, the first day of the offering period. We applied modification accounting in accordance with the relevant accounting guidance. The total incremental fair value associated with this Purchase Plan “reset” was approximately $753,000 and is being recognized as expense from January 1, 2020 to December 31, 2021.
As of March 31, 2020, there were 583,893 shares reserved for future issuance under the Purchase Plan and there was $926,000 of unrecognized stock-based compensation cost related to our Purchase Plan. The following table summarizes the weighted-average assumptions related to our Purchase Plan for the three months ended March 31, 2020 and 2019. Expected volatilities for our Purchase Plan are based on the historical volatility of our stock. Expected term represents the weighted-average of the purchase periods within the offering period. The risk-free interest rate for periods within the expected term is based on U.S. Treasury constant maturity rates.
|
|
|
|
|
|
|
|
|
|
|
Three Months Ended
|
|
|
|
|
|
March 31,
|
|
|
|
|
|
2020
|
|
2019
|
|
|
|
Risk-free interest rate
|
|
1.6
|
%
|
2.7
|
%
|
|
|
Expected term (in years)
|
|
1.6
|
|
1.5
|
|
|
|
Dividend yield
|
|
0.0
|
%
|
0.0
|
%
|
|
|
Expected volatility
|
|
57.7
|
%
|
62.6
|
%
|
|
7.Revenues
Revenues disaggregated by category were as follows (in thousands):
|
|
|
|
|
|
|
|
|
|
|
|
|
Three Months Ended
|
|
|
|
|
|
March 31,
|
|
|
|
|
|
2020
|
|
2019
|
|
|
|
Product sales:
|
|
|
|
|
|
|
|
|
|
Gross product sales
|
|
$
|
15,371
|
|
$
|
9,916
|
|
|
|
Discounts and allowances
|
|
|
(2,691)
|
|
|
(1,862)
|
|
|
|
Product sales, net
|
|
$
|
12,680
|
|
$
|
8,054
|
|
|
|
|
|
|
|
|
|
|
|
|
|
Revenues from collaborations:
|
|
|
|
|
|
|
|
|
|
License revenues
|
|
|
39,858
|
|
|
4,499
|
|
|
|
Research and development services and others
|
|
|
3,223
|
|
|
71
|
|
|
|
Total revenues from collaborations
|
|
|
43,081
|
|
|
4,570
|
|
|
|
Total revenues
|
|
$
|
55,761
|
|
$
|
12,624
|
|
|
The following table summarizes revenues from each of our customers who individually accounted for 10% or more of our total revenues (as a percentage of total revenues):
|
|
|
|
|
|
|
|
|
|
|
|
|
Three Months Ended
|
|
|
|
|
|
March 31,
|
|
|
|
|
|
2020
|
|
2019
|
|
|
|
Grifols
|
|
|
77%
|
|
|
36%
|
|
|
|
ASD Healthcare and Oncology Supply
|
|
|
12%
|
|
|
33%
|
|
|
|
McKesson Specialty Care Distribution Corporation
|
|
|
9%
|
|
|
24%
|
|
|
|
|
|
|
|
|
|
|
|
|
We commenced commercial sale of TAVALISSE in the U.S. in May 2018 after FDA approval in April 2018. Our MAA for fostamatinib for the treatment of chronic ITP in adult patients who are refractory to other treatments was approved by the EC in January 2020.
In addition to the distribution agreements with our customers, the SDs, we also enter into arrangements with specialty pharmacy providers, in-office dispensing providers, group purchasing organizations, and government entities that provide for government-mandated and/or privately-negotiated rebates, chargebacks and discounts with respect to the purchase of our products which reduced our gross product sales. Also refer to Revenue Recognition policy discussion in Note 3.
The following table summarizes activity in each of the product revenue allowance and reserve categories for the three months ended March 31, 2020 and 2019 (in thousands):
|
|
|
|
|
|
|
|
|
|
|
|
|
|
|
|
|
Chargebacks,
|
|
Government
|
|
|
|
|
|
|
|
Discounts and
|
|
and Other
|
|
|
|
|
|
|
|
Fees
|
|
Rebates
|
|
Returns
|
|
Total
|
|
Balance at January 1, 2020
|
|
$
|
1,293
|
|
$
|
1,801
|
|
$
|
238
|
|
$
|
3,332
|
|
Provision related to current period sales
|
|
|
1,487
|
|
|
745
|
|
|
—
|
|
|
2,232
|
|
Credit or payments made during the period
|
|
|
(1,324)
|
|
|
(627)
|
|
|
(58)
|
|
|
(2,009)
|
|
Balance at March 31, 2020
|
|
$
|
1,456
|
|
$
|
1,919
|
|
$
|
180
|
|
$
|
3,555
|
|
|
|
|
|
|
|
|
|
|
|
|
|
|
|
|
|
Chargebacks,
|
|
Government
|
|
|
|
|
|
|
|
|
|
Discounts and
|
|
and Other
|
|
|
|
|
|
|
|
|
|
Fees
|
|
Rebates
|
|
Returns
|
|
Total
|
|
Balance at January 1, 2019
|
|
$
|
622
|
|
$
|
843
|
|
$
|
170
|
|
$
|
1,635
|
|
Provision related to current period sales
|
|
|
855
|
|
|
706
|
|
|
99
|
|
|
1,660
|
|
Credit or payments made during the period
|
|
|
(735)
|
|
|
(323)
|
|
|
—
|
|
|
(1,058)
|
|
Balance at March 31, 2019
|
|
$
|
742
|
|
$
|
1,226
|
|
$
|
269
|
|
$
|
2,237
|
The discounts and allowances from gross product sales for the three months ended March 31, 2020 of $2.7 million in the first table above includes the provision for current period sales of $2.2 million which formed part of Other Accrued Liabilities in the balance sheet of which $3.5 million remained outstanding as of March 31, 2020. Of the $2.7 million discounts and allowances from gross sales, $467,000 is recorded as reduction in accounts receivable and prepaid and other current assets in the balance sheet.
As of March 31, 2020, we have accounts receivable from Aclaris of $1.0 million, relative to the first amendment to the license and collaboration agreement with Aclaris. We determined that no allowance for doubtful accounts was necessary for our accounts receivable as of March 31, 2020.
8.Sponsored Research and License Agreements
We conduct research and development programs independently and in connection with our corporate collaborators. As of March 31, 2020, we are a party to collaboration agreements with ongoing performance obligations with Kissei Pharmaceutical Co., Ltd. (Kissei) for the development and commercialization of fostamatinib in Japan, China, Taiwan and the Republic of Korea and with Grifols, S.A. (Grifols) to commercialize fostamatinib in all indications, including chronic ITP and AIHA, in Europe and Turkey and with Medison Pharma Ltd. (Medison) to commercialize fostamatinib in all indications, including chronic ITP and AIHA, in Canada and Israel. As of March 31, 2020, we are also a party to collaboration agreements, but do not have ongoing performance obligations, with Aclaris for the development and commercialization of JAK inhibitors for the treatment of alopecia areata and other dermatological conditions, AZ for the development and commercialization of R256, an inhaled JAK inhibitor, BerGenBio for the development and commercialization of AXL inhibitors in oncology, and Daiichi to pursue research related to MDM2 inhibitors, a novel class of drug targets called ligases.
Under these agreements, which we entered into in the ordinary course of business, we received or may be entitled to receive upfront cash payments, payments contingent upon specified events achieved by such partners and royalties on any net sales of products sold by such partners under the agreements. Total future contingent payments to us under all of these agreements could exceed $611.7 million if all potential product candidates achieved all of the payment triggering events under all of our current agreements (based on a single product candidate under each agreement). Of this amount, up to $70.5 million relates to the achievement of development events, up to $165.2 million relates to the achievement of regulatory events and up to $376.0 million relates to the achievement of certain commercial or launch events. This estimated future contingent amount does not include any estimated royalties that could be due to us if the partners successfully commercialize any of the licensed products. Future events that may trigger payments to us under the agreements are based solely on our partners’ future efforts and achievements of specified development, regulatory and/or commercial events.
Grifols License Agreement
In January 2019, we entered into an exclusive license agreement with Grifols to commercialize fostamatinib in all indications, including chronic ITP and AIHA, in Europe and Turkey. Under the agreement, we received an upfront payment of $30.0 million, with the potential for $297.5 million in total regulatory and commercial milestones, which included a $20.0 million payment upon approval from the European Medicines Agency (EMA) for fostamatinib in chronic ITP as discussed below. We will also receive stepped double-digit royalty payments based on tiered net sales which may reach 30% of net sales. In return, Grifols will receive exclusive rights to fostamatinib in human diseases, including chronic ITP and AIHA, in Europe and Turkey. The agreement also requires us to conduct the Phase 3 trial in AIHA in the U.S.
In January 2020, we received EC’s approval of our MAA for fostamatinib for the treatment of chronic ITP in adult patients who are refractory to other treatments. With this approval, we received a $20.0 million non-refundable payment in February 2020, which is comprised of a $17.5 million for EMA approval of fostamatinib for the first indication and a $2.5 million creditable advance royalty payment, based on the terms of the collaboration agreement. The $20.0 million payment will be allocated to the distinct performance obligation in the collaboration agreement with Grifols.
We accounted for this agreement under ASC 606 and identified the following distinct performance obligations at inception of the agreement: (a) granting of the license, (b) performance of research and regulatory services related to our ongoing long-term open-label extension study on patients with ITP, and (c) performance of clinical services related to our Phase 3 study in AIHA. In addition, we will enter into a commercial supply agreement for the licensed territories. We concluded each of these performance obligations is distinct. We based our assessment on the following: (i) our assessment that Grifols can benefit from the license on its own by developing and commercializing the underlying product using its own resources, and (ii) the fact that the manufacturing services are not highly specialized in nature and can be performed by other vendors. Upon execution of our agreement with Grifols, we determined that the upfront fee of $5.0 million, which is the non-refundable portion of the $30.0 million upfront fee, represented the transaction price. In
the first quarter of 2020, we revised the transaction price to include the $25.0 million of the upfront payment that is no longer refundable under our agreement and the $20.0 million payment received that is no longer constrained. We allocated the updated transaction price to the distinct performance obligations in our collaboration agreement based on our best estimate of the relative standalone selling price as follows: (a) for the license, we estimated the standalone selling price using the adjusted market assessment approach to estimate its standalone selling price in the licensed territories; (b) for the research and regulatory services, we estimated the standalone selling price using the cost plus expected margin approach. As a result of the adjusted transaction price, adjustments are recorded on a cumulative catch-up basis, and recorded as part of contract revenues from collaborations in the first quarter of 2020.
The remaining future variable consideration of $277.5 million related to future regulatory and commercial milestones were fully constrained until we can ascertain that significant reversal of cumulative revenue would not occur, given the inherent uncertainty of success with these future milestones. We will recognize revenues related the research and regulatory services throughout the term of the respective clinical programs using the input method. For sales-based milestones and royalties, we determined that the license is the predominant item to which the royalties or sales-based milestones relate. Accordingly, we will recognize revenue at the later of (i) when the related sales occur, or (ii) when the performance obligation to which some or all of the royalty has been allocated has been satisfied (or partially satisfied). We will re-evaluate the transaction price in each reporting period and as uncertain events are resolved or other changes in circumstances occur.
During the three months ended March 31, 2020, we recognized $39.9 million in revenues related to the licensed rights in intellectual property and $3.2 million in revenues related to the research services performed. Deferred revenues as of March 31, 2020 was $2.2 million.
Kissei License Agreement
In October 2018, we entered into an exclusive license and supply agreement with Kissei to develop and commercialize fostamatinib in all current and potential indications in Japan, China, Taiwan and the Republic of Korea. Kissei is responsible for performing and funding all development activities for fostamatinib in the above-mentioned territories. We received an upfront cash payment of $33.0 million, with the potential for up to an additional $147.0 million in development, regulatory and commercial milestone payments, and will receive mid to upper twenty percent, tiered, escalated net sales-based payments for the supply of fostamatinib. Under the agreement, we granted Kissei the license rights to fostamatinib in the territories above and are obligated to supply Kissei with drug product for use in clinical trials and pre-commercialization activities. We are also responsible for the manufacture and supply of fostamatinib for all future development and commercialization activities under the agreement.
We accounted for this agreement under ASC 606 and identified the following distinct performance obligations at inception of the agreement: (a) granting of the license, (b) supply of fostamatinib for clinical use and (c) material right associated with discounted fostamatinib that are supplied for use other than clinical or commercial. In addition, we will provide commercial product supply if the product is approved in the licensed territory. We concluded that each of these performance obligations is distinct. We based our assessment on the following: (i) our assessment that Kissei can benefit from the license on its own by developing and commercializing the underlying product using its own resources and (ii) the fact that the manufacturing services are not highly specialized in nature and can be performed by other vendors. Moreover, we determined that the upfront fee of $33.0 million represented the transaction price and was allocated to the performance obligations based on our best estimate of the relative standalone selling price as follows: (a) for the license, we estimated the standalone selling price using the adjusted market assessment approach to estimate its standalone selling price in the licensed territories; (b) for the supply of fostamatinib and the material right associated with discounted fostamatinib, we estimated the standalone selling price using the cost plus expected margin approach. Variable consideration of $147.0 million related to future development and regulatory milestones was fully constrained due to the fact that it was probable that a significant reversal of cumulative revenue would occur, given the inherent uncertainty of success with these future milestones. We will recognize revenues related to the supply of fostamatinib and material right upon delivery of fostamatinib to Kissei. For sales-based milestones and royalties, we determined that the license is the predominant item to which the royalties or sales-based milestones relate to. Accordingly, we will recognize revenue at the later of (i) when the related sales occur, or (ii) when the performance obligation to which some or all of
the royalty has been allocated has been satisfied (or partially satisfied). We will re-evaluate the transaction price in each reporting period and as uncertain events are resolved or other changes in circumstances occur.
We did not recognize any revenues during the three months ended March 31, 2020. At March 31, 2020, deferred revenues related to the unsatisfied performance obligations related to the supply of fostamatinib and material right associated with discounted fostamatinib supply was $1.4 million.
Other license agreements
As of March 31, 2020, we have accounts receivable of $1.0 million relative to the first amendment to the license and collaboration agreement with Aclaris executed in the fourth quarter of 2019, of which $500,000 was received in April 2020.
In October 2019, we entered into two exclusive commercial and license agreements with Medison for the commercialization of fostamatinib for chronic ITP in Israel and in Canada pursuant to which we received a $5.0 million upfront payment with respect to the agreement in Canada. We accounted for the agreement made with an upfront payment under ASC 606 and identified the following combined performance obligations at inception of the agreement: (a) granting of the license and (b) obtaining regulatory approval in Canada of fostamatinib in ITP. We determined that the non-refundable upfront fee of $5.0 million represented the transaction price. However, under the agreement, we have the option to buy back all rights to the product in Canada within six months from obtaining regulatory approval for the treatment of AIHA in Canada. The buyback option precludes us from transferring control of the license to Medison under ASC 606. We believe that the buyback provision, if exercised, will require us to repurchase the license at an amount equal to or more than the upfront $5.0 million. As such this arrangement is accounted for as a financing arrangement. Accrued interest expense related to this financing arrangement as of March 31, 2020 is immaterial.
9.Inventories
As of March 31, 2020 and December 31, 2019, we have the following inventories (in thousands):
|
|
|
|
|
|
|
|
|
|
|
|
|
|
|
|
|
|
|
|
|
March 31,
|
|
December 31,
|
|
|
|
|
2020
|
|
2019
|
|
|
Work in process
|
|
$
|
383
|
|
$
|
810
|
|
|
Finished goods
|
|
|
1,239
|
|
|
544
|
|
|
Total
|
|
$
|
1,622
|
|
$
|
1,354
|
|
As of March 31, 2020, we have $3.0 million in advance payments to our manufacturer of our raw materials, which is included as part of “Prepaid and other current assets” in our condensed balance sheet. We take ownership of such raw materials when they are completed and delivered to us.
10.Cash, Cash Equivalents and Short-Term Investments
Cash, cash equivalents and short-term investments consisted of the following (in thousands):
|
|
|
|
|
|
|
|
|
|
|
|
March 31,
|
|
December 31,
|
|
|
|
|
2020
|
|
2019
|
|
|
Cash
|
|
$
|
3,131
|
|
$
|
3,371
|
|
|
Money market funds
|
|
|
35,401
|
|
|
7,457
|
|
|
U.S. treasury bills
|
|
|
9,544
|
|
|
12,539
|
|
|
Government-sponsored enterprise securities
|
|
|
8,635
|
|
|
19,017
|
|
|
Corporate bonds and commercial paper
|
|
|
39,215
|
|
|
55,694
|
|
|
|
|
$
|
95,926
|
|
$
|
98,078
|
|
|
Reported as:
|
|
|
|
|
|
|
|
|
Cash and cash equivalents
|
|
$
|
45,225
|
|
$
|
22,521
|
|
|
Short-term investments
|
|
|
50,701
|
|
|
75,557
|
|
|
|
|
$
|
95,926
|
|
$
|
98,078
|
|
Cash equivalents and short-term investments include the following securities with gross unrealized gains and losses (in thousands):
|
|
|
|
|
|
|
|
|
|
|
|
|
|
|
|
|
|
|
|
|
Gross
|
|
Gross
|
|
|
|
|
|
|
|
Amortized
|
|
Unrealized
|
|
Unrealized
|
|
|
|
|
|
March 31, 2020
|
|
Cost
|
|
Gains
|
|
Losses
|
|
Fair Value
|
|
|
U.S. treasury bills
|
|
$
|
9,512
|
|
$
|
32
|
|
$
|
—
|
|
$
|
9,544
|
|
|
Government-sponsored enterprise securities
|
|
$
|
8,612
|
|
$
|
23
|
|
$
|
—
|
|
$
|
8,635
|
|
|
Corporate bonds and commercial paper
|
|
|
39,192
|
|
|
32
|
|
|
(9)
|
|
|
39,215
|
|
|
Total
|
|
$
|
57,316
|
|
$
|
87
|
|
$
|
(9)
|
|
$
|
57,394
|
|
|
|
|
|
|
|
|
|
|
|
|
|
|
|
|
|
|
|
|
|
|
Gross
|
|
Gross
|
|
|
|
|
|
|
|
Amortized
|
|
Unrealized
|
|
Unrealized
|
|
|
|
|
|
December 31, 2019
|
|
Cost
|
|
Gains
|
|
Losses
|
|
Fair Value
|
|
|
U.S. treasury bills
|
|
$
|
12,532
|
|
$
|
8
|
|
$
|
(1)
|
|
$
|
12,539
|
|
|
Government-sponsored enterprise securities
|
|
|
19,010
|
|
|
8
|
|
|
(1)
|
|
$
|
19,017
|
|
|
Corporate bonds and commercial paper
|
|
|
55,685
|
|
|
14
|
|
|
(5)
|
|
|
55,694
|
|
|
Total
|
|
$
|
87,227
|
|
$
|
30
|
|
$
|
(7)
|
|
$
|
87,250
|
|
As of March 31, 2020, our cash equivalents and short-term investments, which have contractual maturities within one year, had a weighted-average time to maturity of approximately 87 days. We view our short-term investments portfolio as available for use in current operations. We have the ability to hold all investments as of March 31, 2020 through their respective maturity dates. At March 31, 2020, we had no investments that had been in a continuous unrealized loss position for more than 12 months. As of March 31, 2020, a total of 10 individual securities had been in an unrealized loss position for 12 months or less, and the losses were determined to be temporary. The gross unrealized losses above were caused by interest rate increases. No significant facts or circumstances have arisen to indicate that there has been any significant deterioration in the creditworthiness of the issuers of the securities held by us. Based on our review of these securities, including the assessment of the duration and severity of the unrealized losses and our ability and intent to hold the investments until maturity, there were no other-than-temporary impairments for these securities at March 31, 2020.
The following table shows the fair value and gross unrealized losses of our investments in individual securities that are in an unrealized loss position, aggregated by investment category (in thousands):
|
|
|
|
|
|
|
|
|
|
March 31, 2020
|
|
Fair Value
|
|
Unrealized Losses
|
|
|
Corporate bonds and commercial paper
|
|
$
|
13,665
|
|
$
|
(9)
|
|
|
Total
|
|
$
|
13,665
|
|
$
|
(9)
|
|
11.Fair Value
Under FASB ASC 820, Fair Value Measurements and Disclosures, fair value is defined as the price at which an asset could be exchanged, or a liability transferred in a transaction between knowledgeable, willing parties in the principal or most advantageous market for the asset or liability. Where available, fair value is based on observable market prices or parameters or derived from such prices or parameters. Where observable prices or parameters are not available, valuation models are applied.
Assets and liabilities recorded at fair value in our financial statements are categorized based upon the level of judgment associated with the inputs used to measure their fair value. Hierarchical levels directly related to the amount of subjectivity associated with the inputs to fair valuation of these assets and liabilities, are as follows:
Level 1—Inputs are unadjusted, quoted prices in active markets for identical assets at the reporting date. Active markets are those in which transactions for the asset or liability occur in sufficient frequency and volume to provide pricing information on an ongoing basis.
The fair valued assets we hold that are generally included under this Level 1 are money market securities where fair value is based on publicly quoted prices.
Level 2—Inputs, other than quoted prices included in Level 1, that are either directly or indirectly observable for the asset or liability through correlation with market data at the reporting date and for the duration of the instrument’s anticipated life.
The fair valued assets we hold that are generally assessed under Level 2 included government-sponsored enterprise securities, U.S. treasury bills and corporate bonds and commercial paper. We utilize third party pricing services in developing fair value measurements where fair value is based on valuation methodologies such as models using observable market inputs, including benchmark yields, reported trades, broker/dealer quotes, bids, offers and other reference data. We use quotes from external pricing service providers and other on-line quotation systems to verify the fair value of investments provided by our third-party pricing service providers. We review independent auditor’s reports from our third-party pricing service providers particularly regarding the controls over pricing and valuation of financial instruments and ensure that our internal controls address certain control deficiencies, if any, and complementary user entity controls are in place.
Level 3—Unobservable inputs that are supported by little or no market activity and that are significant to the fair value of the assets or liabilities and which reflect management’s best estimate of what market participants would use in pricing the asset or liability at the reporting date. Consideration is given to the risk inherent in the valuation technique and the risk inherent in the inputs to the model.
We do not have fair valued assets and liabilities classified under Level 3.
Fair Value on a Recurring Basis
Financial assets measured at fair value on a recurring basis are categorized in the tables below based upon the lowest level of significant input to the valuations (in thousands):
|
|
|
|
|
|
|
|
|
|
|
|
|
|
|
|
|
|
Assets at Fair Value as of March 31, 2020
|
|
|
|
|
Level 1
|
|
Level 2
|
|
Level 3
|
|
Total
|
|
|
Money market funds
|
|
$
|
35,401
|
|
$
|
—
|
|
$
|
—
|
|
$
|
35,401
|
|
|
U.S. treasury bills
|
|
|
—
|
|
|
9,544
|
|
|
—
|
|
|
9,544
|
|
|
Government-sponsored enterprise securities
|
|
|
—
|
|
|
8,635
|
|
|
—
|
|
|
8,635
|
|
|
Corporate bonds and commercial paper
|
|
|
—
|
|
|
39,215
|
|
|
—
|
|
|
39,215
|
|
|
Total
|
|
$
|
35,401
|
|
$
|
57,394
|
|
$
|
—
|
|
$
|
92,795
|
|
|
|
|
|
|
|
|
|
|
|
|
|
|
|
|
|
|
|
Assets at Fair Value as of December 31, 2019
|
|
|
|
|
Level 1
|
|
Level 2
|
|
Level 3
|
|
Total
|
|
|
Money market funds
|
|
$
|
7,457
|
|
$
|
—
|
|
$
|
—
|
|
$
|
7,457
|
|
|
U.S. treasury bills
|
|
|
—
|
|
|
12,539
|
|
|
—
|
|
|
12,539
|
|
|
Government-sponsored enterprise securities
|
|
|
—
|
|
|
19,017
|
|
|
—
|
|
|
19,017
|
|
|
Corporate bonds and commercial paper
|
|
|
—
|
|
|
55,694
|
|
|
—
|
|
|
55,694
|
|
|
Total
|
|
$
|
7,457
|
|
$
|
87,250
|
|
$
|
—
|
|
$
|
94,707
|
|
12.Lease Agreements
We currently lease our research and office space under a noncancelable lease agreement with our landlord, Healthpeak Properties, Inc. (formerly known as HCP BTC, LLC) which was originally set to expire in 2018. The lease term provides for renewal option for up to two additional periods of five years each. In July 2017, we exercised our option to extend the term of our lease for another five years through January 2023 and modified the amount of monthly base rent during such renewal period.
In December 2014, we entered into a sublease agreement, which was amended in 2017, with an unrelated third party to occupy approximately 57,000 square feet of our research and office space. In February 2017, we entered into an amendment to the sublease agreement to increase the subleased research and office space for an additional 9,328 square feet under the same term of the sublease. Effective July 2017, the sublease agreement was amended primarily to extend the term of the sublease through January 2023 and modified the monthly base rent to equal the amount we will pay our landlord. Because the future sublease income under the extended sublease agreement is the same as the amount we will pay our landlord, we did not recognize any loss on sublease relative to this amendment. We expect to receive approximately $12.9 million in future sublease income (excluding our subtenant’s share of facilities operating expenses) through January 2023.
We adopted Topic 842 on January 1, 2019 using a modified retrospective approach and elected the transition method and the package of practical expedients permitted under the transition guidance, which allowed us to carryforward our historical lease classification and our assessment on whether a contract is or contains a lease. We also elected to combine lease and non-lease components, such as common area maintenance charges, as single lease, and elected to use the short-term lease exception permitted by the standard.
As a result of the adoption of Topic 842 on January 1, 2019, we recognized $32.8 million in operating right-of-use asset and $33.2 million in lease liability, and derecognized $399,000 of deferred rent in the balance sheet at adoption date. These were calculated using the present value of our remaining lease payments using an estimated incremental borrowing rate of 9%, which represented the weighted average discount rate for our lease. There was no cumulative-effect adjustment on our accumulated deficit as of January 1, 2019. As of March 31, 2020, we had operating lease right-of-use asset of $23.8 million and lease liability of $25.1 million in the balance sheet. The weighted average remaining term of our lease as of March 31, 2020 was 2.83 years.
During the quarter, we received reimbursements from our landlord for their partial share in the generator and boiler leasehold improvements. We record these leasehold improvement incentives as additional operating lease right-of-use asset and lease liability until the lease ends and the asset is transferred. As of March 31, 2020, our leasehold improvement incentives amounted to $346,000.
For the three months ended March 31, 2020, the components of our operating lease expense were as follows (in thousands):
|
|
|
|
|
|
|
|
|
Three Months Ended
|
|
|
|
|
March 31, 2020
|
|
Fixed operating lease expense
|
|
$
|
1,340
|
|
Variable operating lease expense
|
|
|
251
|
|
Total operating lease expense
|
|
$
|
1,591
|
Supplemental information related to the Company’s operating lease for the three months ended March 31, 2020 were as follow (in thousands):
|
|
|
|
|
|
Cash payments included in the measurement of operating lease liabilities
|
|
$
|
2,400
|
|
Right-of-use asset obtained in exchange for operating lease obligations
|
|
|
—
|
The following table presents the future lease payments of our operating lease liabilities as of March 31, 2020 (in thousands):
|
|
|
|
|
|
Remainder of 2020
|
|
$
|
7,294
|
|
2021
|
|
|
10,082
|
|
2022
|
|
|
10,485
|
|
2023
|
|
|
877
|
|
Total operating lease payments
|
|
|
28,738
|
|
Less: imputed interest
|
|
|
(3,653)
|
|
Total operating lease liabilities
|
|
$
|
25,085
|
For the three months ended March 31, 2020, we have the following operating sublease information (in thousands):
|
|
|
|
|
|
|
|
|
Three Months Ended
|
|
|
|
|
March 31, 2020
|
|
Fixed sublease expense
|
|
$
|
1,095
|
|
Variable sublease expense
|
|
|
223
|
|
Sublease income
|
|
|
(1,318)
|
|
Net
|
|
$
|
—
|
The following table presents the future lease payments we expect to receive under our sublease as of March 31, 2020 (in thousands):
|
|
|
|
|
|
Remainder of 2020
|
|
$
|
3,280
|
|
2021
|
|
|
4,534
|
|
2022
|
|
|
4,716
|
|
2023
|
|
|
394
|
|
Total operating lease liabilities
|
|
$
|
12,924
|
13.Debt
On September 27, 2019, we entered into a Credit and Security Agreement (Credit Agreement), dated as of September 27, 2019 (the Closing Date) with MidCap Financial Trust (MidCap). The Credit Agreement provides for a $60.0 million term loan credit facility with the following tranches: (i) on the Closing Date, $10.0 million aggregate principal amount of term loans, (ii) until December 31, 2020, an additional $10.0 million term loan facility at our option, (iii) until March 31, 2021, an additional $20.0 million term loan facility subject to the satisfaction of certain conditions and at our option and (iv) until March 31, 2022, an additional $20.0 million term loan facility subject to the satisfaction of certain conditions and at our option. The obligations under the Credit Agreement are secured by a perfected security interest in all of our assets except for intellectual property and certain other customary excluded property pursuant to the terms of the Credit Agreement.
The outstanding principal balance of the loan bears interest at an annual rate of one-month LIBOR plus 5.65%, subject to a LIBOR floor of 1.50% and is payable monthly in arrears. Commencing on October 1, 2019, we initially will make interest-only payments for 24 months followed by 36 months of amortization payments. The interest-only period will be extended to 36 months and again to 48 months upon the satisfaction of certain conditions set forth in the Credit Agreement. All unpaid principal and accrued interest is due and payable no later than September 1, 2024. A final payment fee of 2.5% of principal is due on the final payment of the term loan.
We may make voluntary prepayments, in whole or in part, subject to certain prepayment premiums and additional interest payments. The Credit Agreement also contains certain provisions, such as event of default and change in control provisions, which, if triggered, would require us to make mandatory prepayments on the term loan, which are subject to certain prepayment premiums and additional interest payments.
As discussed above, at closing of the Credit Agreement, $10.0 million was funded in an initial tranche. The facility also gives us the ability to access an additional $50.0 million at our option, of which $40.0 million is subject to the achievement of certain customary conditions. In March 2020, we signed a credit extension form for the second tranche amounting to $10.0 million, which we received in May 2020.
Excluding the second tranche of $10.0 million, the following table presents the future minimum payments we expect to make on our outstanding loan as of March 31, 2020 (in thousands):
|
|
|
|
|
|
|
|
|
|
|
Year Ending December 31,
|
|
|
|
|
2021
|
|
$
|
556
|
|
2022
|
|
|
3,333
|
|
2023
|
|
|
3,333
|
|
2024
|
|
|
2,778
|
|
Principal amount (initial tranche)
|
|
$
|
10,000
|
We paid certain costs and fees totaling $211,000 which were recorded as a direct deduction from the term loan on the balance sheet and are being amortized ratably as interest expense over the term of the loan, using the effective interest method. As of March 31, 2020, the unamortized issuance costs and debt discounts amounted to $171,000.
Interest expense, including amortization of the debt discount and accretion of the final fees, related to the Credit Agreement was $241,000 for the three months ended March 31, 2020. Accrued interest was $62,000 as of March 31, 2020. As of March 31, 2020, the outstanding balance of the loan was $9.8 million, net of unamortized debt discount.
The Credit Agreement contains certain covenants which, among others, require us to deliver financial reports at designated times of the year and maintain minimum net revenues and $10.0 million of cash upon the draw of tranche three or tranche four. As of March 31, 2020, we were not in violation of any covenants.
14.Subsequent Events
Under our credit facility agreement with MidCap, in March 2020, we signed a credit extension form for the second tranche amounting to $10.0 million, which we received in May 2020. The facility also gives us the ability to access an additional $40.0 million at our option subject to the achievement of certain customary conditions.
Item 2.Management’s Discussion and Analysis of Financial Condition and Results of Operations
This discussion and analysis should be read in conjunction with our financial statements and the accompanying notes included in this report and the audited financial statements and accompanying notes included in our Annual Report on Form 10-K for the year ended December 31, 2019. Our financial results for the three months ended March 31, 2020 are not necessarily indicative of results that may occur in future interim periods or for the full fiscal year.
This Quarterly Report on Form 10-Q contains statements indicating expectations about future performance and other forward-looking statements within the meaning of Section 27A of the Securities Act and Section 21E of the Exchange Act, that involve risks and uncertainties. We usually use words such as “may,” “will,” “would,” “should,” “could,” “expect,” “plan,” “anticipate,” “believe,” “estimate,” “predict,” “intend,” or the negative of these terms or similar expressions to identify these forward-looking statements. These statements appear throughout this Quarterly Report on Form 10-Q and are statements regarding our current expectation, belief or intent, primarily with respect to our operations and related industry developments. Examples of these statements include, but are not limited to, statements regarding the following: our expectations regarding the impact of the global COVID-19 pandemic; our business and scientific strategies; risks and uncertainties associated with the commercialization and marketing of TAVALISSE; in the U.S. and in Europe; risks that the FDA, EMA or other regulatory authorities may make adverse decisions regarding fostamatinib; the progress of our and our collaborators’ product development programs, including clinical testing, and the timing of results thereof; our corporate collaborations and revenues that may be received from our collaborations and the timing of those potential payments; our expectations with respect to regulatory submissions and approvals; our drug discovery technologies; our research and development expenses; protection of our intellectual property; sufficiency of our cash and capital resources and the need for additional capital; and our operations and legal risks. You should not place undue reliance on these forward-looking statements. Our actual results could differ materially from those anticipated in these forward-looking statements for many reasons, including as a result of the risks and uncertainties discussed under the heading “Risk Factors” in Item 1A of Part II of this Quarterly Report on Form 10-Q. Any forward-looking statement speaks only as of the date on which it is made, and we undertake no obligation to update any forward-looking statement to reflect events or circumstances after the date on which the statement is made or to reflect the occurrence of unanticipated events. New factors emerge from time to time, and it is not possible for us to predict which factors will arise. In addition, we cannot assess the impact of each factor on our business or the extent to which any factor, or combination of factors, may cause actual results to differ materially from those contained in any forward-looking statements.
Overview
We are a biotechnology company dedicated to discovering, developing and providing novel small molecule drugs that significantly improve the lives of patients with immune and hematologic disorders, cancer and rare diseases. Our pioneering research focuses on signaling pathways that are critical to disease mechanisms. Our first U.S. Food and Drug Administration (FDA) approved product is TAVALISSE® (fostamatinib disodium hexahydrate), the only oral spleen tyrosine kinase (SYK) inhibitor, for the treatment of adult patients with chronic immune thrombocytopenia (ITP) who have had an insufficient response to a previous treatment. The marketing authorization application (MAA) for fostamatinib has been approved by the European Commission (EC) in Europe for the treatment of chronic ITP in adult patients who are refractory to other treatments, and will be marketed in Europe under the name TAVLESSE® (fostamatinib). Our clinical programs include a Phase 3 study of fostamatinib in warm autoimmune hemolytic anemia (AIHA); a completed Phase 1 study of R835, a proprietary molecule from our interleukin receptor associated kinase (IRAK 1/4) inhibitor program; and an ongoing Phase 1 study of R552, a proprietary molecule from our receptor-interacting protein kinase (RIP1) inhibitor program. In addition, we have product candidates in clinical development with
partners BerGenBio ASA (BerGenBio), Daiichi Sankyo (Daiichi), Aclaris Therapeutics (Aclaris), and AstraZeneca AB (AZ).
Business Update
In the first quarter of 2020, 1,398 bottles of TAVALISSE were shipped to patients and clinics with net product sales increasing 57% year over year to $12.7 million. During the quarter, we experienced typical first quarter reimbursement issues such as the resetting of co-pays and the Medicare donut hole, and were also impacted negatively by the COVID-19 pandemic in the latter part of the quarter. As of March 31, 2020, a total of 591 bottles remained in our distribution channels, a decrease of 5 bottles from the previous quarter.
Due to the ongoing COVID-19 global pandemic, resources have been deployed to enable our field-based employees to continue to engage remotely with health care providers. These virtual engagements have enabled our field team to support existing prescribers as well as partner with new prescribers to identify appropriate patients for TAVALISSE.
We are exploring opportunities to collaborate with research institutes to investigate the potential of TAVALISSE to treat COVID-19 pneumonia and related acute respiratory distress syndrome (ARDS). The SYK signaling pathway plays a known role in mediating the release of cytokines in response to the COVID-19 virus, providing scientific rationale for investigating the potential benefit of SYK-inhibition in these patients.
We currently do not anticipate disruption in the supply of TAVALISSE tablets and drug substance to meet the needs of our U.S. ITP commercial business, as well as our collaborative partners and clinical trials worldwide.
Our FORWARD study, a pivotal Phase 3 clinical trial in warm AIHA has enrolled 41 patients to date. Currently, the FORWARD study has over 80 active clinical trial sites established across 22 countries. A vast majority of these sites have temporarily postponed new patient enrollment due to the ongoing COVID-19 pandemic. As such, we are unable to provide guidance on the timing of enrollment completion. Enrollment is expected to regain momentum as conditions permit across our globally diverse clinical sites.
In February 2020, we received a $20.0 million payment from Grifols. The payment was received upon the EC approval of the MAA for fostamatinib for the treatment of chronic ITP in adult patients who are refractory to other treatments. In addition, as a result of the EC approval, the $25.0 million of the $30.0 million upfront fee that we previously received from Grifols will no longer be repayable by us to Grifols. Fostamatinib will be marketed in Europe under the brand name TAVLESSE™ (fostamatinib).
With our cash and cash equivalents as of March 31, 2020 of approximately $95.9 million and expected cash flow from operations, we believe our sources of liquidity and capital will be sufficient to finance our continued operations and growth strategy for at least the next twelve months. In May 2020, we accessed the second $10.0 million tranche from our $60.0 million credit facility with MidCap. The facility provides us with access to an additional $40.0 million which is subject to the achievement of certain conditions.
Update on Current and Potential Future Impact of COVID-19 to our Business
In December 2019, a novel coronavirus disease (COVID-19) was reported and in March 2020, the World Health Organization characterized COVID-19 as a global pandemic. With the global spread of the evolving COVID-19 pandemic, we have undertaken and plan to continue to undertake additional safety measures to keep our staff and their families safe and to help the communities where we live and work reduce the number of people exposed to the virus. We have closed our office in South San Francisco and required most of our personnel, including our administrative employees to work remotely, restricted on-site staff to only those personnel who must perform essential activities, suspended new laboratory research and limited the number of staff in any given research and development laboratory. In March 2020, through our existing Crisis Management Team (CMT), we also activated our business continuity plans to prevent or minimize business disruption and ensure the safety and well-being of our personnel. Our
CMT meets regularly to assess the effectiveness of our business continuity plans and make adjustments accordingly as COVID-19 continues to evolve. The ultimate impact of the COVID-19 pandemic is highly uncertain and subject to change. We do not yet know the full extent of the impacts on our business, sales of our product, our ability to continue to secure new collaborations and support existing collaboration efforts with our partners and our clinical and regulatory activities.
Since the COVID-19 pandemic was declared, we have observed reduced patient-doctor interactions and our representatives are having fewer visits with health care providers, which negatively affected our product sales and may continue to negatively affect our product sales in the future. Resources have been deployed to enable our field team to have virtual engagements to support existing prescribers as well as partner with new prescribers to identify appropriate patients for TAVALISSE. As such, our field- based employees are continuing to engage remotely with health care providers. Other commercial related activities, such as our marketing programs, speaker bureaus, and market access initiatives that were in live forums have been delayed or cancelled as a result of the COVID-19 pandemic. These activities have been re-instigated to take place virtually.
With respect to our supply chain, we currently do not anticipate significant disruption in the supply chain for our commercial product, TAVALISSE. However, we do not know the full extent of the impact on our supply chain if the COVID-19 pandemic continues and persists for an extended period of time. We currently rely on third parties to, among other things, manufacture and ship our commercial product, raw materials and product supply for our clinical trials, perform quality testing and supply other goods and services to help manage our commercial activities, our clinical trials and our operations in the ordinary course of business. We have engaged actively with various elements of our supply chain and distribution channel, including our customers, contract manufacturers, and logistics and transportation provider, to meet demand for TAVALISSE and to remain informed of any challenges within our supply chain. We continue to monitor demand, and intend to adapt our plans as needed to continue to drive our business and meet our obligations during the evolving COVID-19 pandemic.
With respect to clinical development, we have taken, and continue to take, measures to implement remote and virtual approaches, including remote patient monitoring where possible per recent FDA guidance and working with our investigators for appropriate care of these patients in a safe manner consistent with agency guidelines. We have a number of ongoing clinical trials, one of which is a global Phase 3 clinical study in warm AIHA. A number of our clinical trial investigators have paused, postponed or delayed new patient enrollment and restricted site visits of existing patients enrolled to protect both site staff and patients. We are making decisions country-by-country to minimize risk to the patients and clinical trial sites. We also rely heavily on our clinical trial investigators to inform us of the best course of action with respect to the temporary pause of enrollment/screening where there is uncertainty around the ability of sites to ensure patient safety or data integrity. Patients already enrolled in our studies continue to receive study drug, and we remain focused on supporting our sites in providing care for these patients and providing continued investigational drug supply. At this time, however, we cannot currently fully forecast the scope of impacts that the COVID-19 pandemic may have on our ability to continue to initiate trial sites, continue to treat patients enrolled in our trials, enroll and assess new patients, supply study drug, obtain complete data points in accordance with the study protocol, and overall impact on clinical study results including the timing thereof.
The COVID-19 pandemic has similarly affected our collaboration and licensing partners for the commercialization of fostamatinib globally, as well as in advancing our various clinical stage programs. We do not yet know the full impact of such disruptions in our partners’ ability to advance commercialization of fostamatinib in the market and the timing of enrollment and completion of various clinical trials being conducted by our collaboration partners.
See also the section titled “Risk Factors” herein for additional information on risks and uncertainties related to the ongoing COVID-19 pandemic.
Our Product Portfolio
The following table summarizes our portfolio:
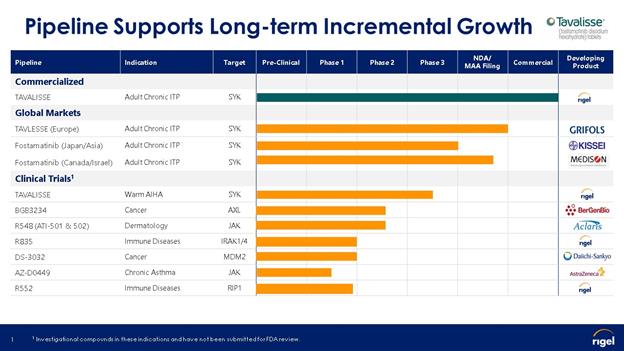
Commercial Product
TAVALISSE in ITP
Disease background. Chronic ITP affects an estimated 83,000 adult patients in the U.S. In patients with ITP, the immune system attacks and destroys the body’s own platelets, which play an active role in blood clotting and healing. ITP patients can suffer extraordinary bruising, bleeding and fatigue as a result of low platelet counts. Current therapies for ITP include steroids, platelet production boosters that imitate thrombopoietin (TPOs) and splenectomy.
Orally available fostamatinib program. Taken in tablet form, fostamatinib blocks the activation of SYK inside immune cells. ITP is typically characterized by the body producing antibodies that attach to healthy platelets in the blood stream. Immune cells recognize these antibodies and affix to them, which activates the SYK enzyme inside the immune cell, and triggers the destruction of the antibody and the attached platelet. When SYK is inhibited by fostamatinib, it interrupts this immune cell function and allows the platelets to escape destruction. The results of our Phase 2 clinical trial, in which fostamatinib was orally administered to 16 adults with chronic ITP, published in Blood, showed that fostamatinib significantly increased the platelet counts of certain ITP patients, including those who had failed other currently available agents.
Our fostamatinib for immune thrombocytopenia (FIT) Phase 3 clinical program had a total of 150 ITP patients that were randomized into two identical multi-center, double-blind, placebo-controlled clinical trials. The patients were diagnosed with persistent or chronic ITP, and had blood platelet counts consistently below 30,000 per microliter of blood. Two-thirds of the subjects received fostamatinib orally at 100 mg twice daily (bid) and the other third received placebo on the same schedule. Subjects were expected to remain on treatment for up to 24 weeks. At week four of treatment, subjects who failed to meet certain platelet counts and met certain tolerability thresholds could have their dosage of fostamatinib (or corresponding placebo) increased to 150 mg bid. The primary efficacy endpoint of this
program was a stable platelet response by week 24 with platelet counts at or above 50,000 per microliter of blood for at least four of the final six qualifying blood draws. In August 2015, the FDA granted our request for Orphan Drug designation for fostamatinib for the treatment of ITP. In February 2020, Kissei was granted orphan drug designation from the Japanese Ministry of Health, Labour and Welfare for R788 (fostamatinib) in chronic ITP.
In August 2016, we announced the results of the first FIT study, reporting that fostamatinib met the study’s primary efficacy endpoint. The study showed that 18% of patients receiving fostamatinib achieved a stable platelet response compared to none receiving a placebo control (p=0.0261). In October 2016, we announced the results of the second FIT study, reporting that the response rate was 18%, consistent with the first study. However, one patient in the placebo group (4%) achieved a stable platelet response, therefore the difference between those on treatment and those on placebo did not reach statistical significance (p=0.152) and the study did not meet its primary endpoint. Using the most conservative sensitivity analysis, rather than the protocol’s prespecified analysis, one more patient in the second study is considered a non-responder, resulting in 8 of 50 (16%) responders on fostamatinib (p = 0.256 vs. placebo). When the data from both studies are combined, however, this difference is statistically significant (p=0.007).
Patients from the FIT studies were given the option to enroll in a long-term open-label extension study and receive treatment with fostamatinib, also a Phase 3 trial. A total of 123 patients enrolled in this study. All the patients who responded to fostamatinib in the FIT studies and enrolled in the long-term open-label extension study maintained a median platelet count of 106,500/uL at a median of 16 months. In addition, there were 44 placebo non-responders that enrolled in the long-term open-label extension study, 41 of which patients had at least 12 weeks of follow-up. Of those, 9 patients (22%) have achieved a prospectively defined stable platelet response, which is statistically significant (p=0.0078) and similar to the response rate fostamatinib achieved in the parent studies.
A stable response was defined as a patient achieving platelet counts of greater than 50,000/uL on more than 4 of the 6 visits between weeks 14 and 24, without rescue medication. In the post-study analysis we performed, a clinically-relevant platelet response was defined to include patients achieving one platelet count over 50,000/uL during the first 12 weeks of treatment, in absence of rescue medication, but who did not otherwise meet the stable response criteria. Once the platelet count of greater than 50,000/uL is achieved, a loss of response was defined as two consecutive platelet counts of less than 30,000/uL in any subsequent visits. In the combined dataset of both stable and clinically-relevant platelet responders for the FIT studies, the response rate was 43% (43/101), compared to 14% (7/49) for placebo (p=0.0006).
In December 2019, we presented data at the 61st American Society of Hematology (ASH) Annual Meeting & Exposition held in Orlando, Florida, which included the post-hoc data analysis we conducted from a Phase 3 clinical program of TAVALISSE in adult patients with ITP. In this analysis, 32 patients received fostamatinib as a second-line therapy, and 78% (25/32) achieved ≥1 platelet count of ≥50,000/µL (without rescue therapy).
The most frequent adverse events were gastrointestinal-related, and the safety profile of the product was consistent with prior clinical experience, with no new or unusual safety issues uncovered.
TAVALISSE was approved by the FDA in April 2018 for the treatment of chronic ITP in adult patients who have had an insufficient response to a previous treatment, and successfully launched in the U.S. in May 2018. In January 2020, the EC granted our MAA in Europe for fostamatinib for the treatment of chronic ITP in adult patients who are refractory to other treatments.
Commercial launch activities, including sales and marketing
A significant portion of our business operations were related to our commercial launch activities for TAVALISSE. Specifically, our marketing and sales efforts are focused on targeting hematologists and hematologist-oncologists in the United States, who manage chronic adult ITP patients.
We have a fully integrated commercial team consisting of sales, marketing, market access, and commercial operations functions. Our sales team promotes TAVALISSE in the U.S. wherein, in the ordinary course of the business, we use customary pharmaceutical company practices to market our products in the U.S. and concentrate our efforts on
hematologists and hematologists-oncologists. TAVALISSE is sold initially through third-party wholesale distribution and specialty pharmacy channels and group purchasing organizations before being ultimately prescribed to patients. To facilitate our commercial activities in the U.S., we also enter into arrangements with various third-parties, including advertising agencies, market research firms and other sales-support-related services as needed. We believe that our commercial team and distribution practices are adequate to ensure that our marketing efforts reach our target customers and deliver our products to patients in a timely and compliant fashion. Also, to help ensure that all eligible patients in the U.S. have appropriate access to TAVALISSE, we have established a comprehensive reimbursement and patient support program called Rigel One Care (ROC). Through ROC, we provide co-pay assistance to qualified, commercially insured patients to help minimize out-of-pocket costs and provide free drug to uninsured or under-insured patients who meet certain clinical and financial criteria. In addition, ROC is designed to provide comprehensive reimbursement support services, such as prior authorization support, benefits investigation and appeals support.
Competitive landscape for TAVALISSE
Our industry is intensely competitive and subject to rapid and significant technological change. TAVALISSE is competing with other existing therapies. In addition, a number of companies are pursuing the development of pharmaceuticals that target the same diseases and conditions that we are targeting. For example, there are existing therapies and drug candidates in development for the treatment of ITP that may be alternative therapies to TAVALISSE.
Currently, corticosteroids remain the most common first line therapy for ITP, occasionally in conjunction with intravenous immuglobulin (IVIg) or anti-Rh(D) to help further augment platelet count recovery, particularly in emergency situations. However, it has been estimated that frontline agents lead to durable remissions in only a small percentage of newly-diagnosed adults with ITP. Moreover, concerns with steroid-related side effects often restrict therapy to approximately four weeks. As such, many patients progress to persistent or chronic ITP, requiring other forms of therapeutic intervention. In long-term treatment of chronic ITP, patients are often cycled through several therapies over time in order to maintain a sufficient response to the disease.
Other approaches to treat ITP are varied in their mechanism of action, and there is no consensus about the sequence of their use. Options include splenectomy, thrombopoietin receptor agonists (TPO-RAs) and various immunosuppressants (such as rituximab). The response rate criteria of the above-mentioned options vary, precluding a comparison of response rates for individual therapies.
Even with the above treatment options, a significant number of patients remain severely thrombocytopenic for long durations and are subject to risk of spontaneous or trauma-induced hemorrhage. The addition of fostamatinib to the treatment options could be beneficial since it has a different mechanism of action than any of the therapies that are currently available. Fostamatinib is a potent and relatively selective SYK inhibitor, and its inhibition of Fc receptors and B-cell receptors of signaling pathways make it a potentially broad immunomodulatory agent.
Other products in the U.S. that are approved by the FDA to increase platelet production through binding and TPO receptors on megakaryocyte precursors include PROMACTA® (Novartis), Nplate® (Amgen, Inc.) and DOPTELET® (Dova Pharmaceuticals).
Fostamatinib in Global Markets
Fostamatinib in Europe/Turkey
In January 2019, we entered into an exclusive commercialization license agreement with Grifols to commercialize fostamatinib for the treatment, palliation, or prevention of human diseases, including chronic or persistent ITP and AIHA, in Europe and Turkey. Pursuant to the terms of the license agreement, Grifols has exclusive rights to commercialize, and non-exclusive rights to develop, fostamatinib in Europe and Turkey. Grifols also received an exclusive option to expand the territory under its exclusive and non-exclusive licenses to include the Middle East, North Africa and Russia (including Commonwealth of Independent States).
We are responsible for performing and funding certain development activities for fostamatinib for ITP and AIHA and Grifols is responsible for all other development activities for fostamatinib in such territories. We remain responsible for the manufacture and supply of fostamatinib for all development and commercialization activities under the agreement. In December 2019, we entered into a Drug Product Purchase Agreement with Grifols wherein we agreed to supply and sell to Grifols at 30% mark up the drug product requested under an anticipated first and only purchase order until Grifols enters into a supply agreement directly with a third-party drug product manufacturer.
Under the terms of the agreement, we received an upfront cash payment of $30.0 million and will be eligible to receive regulatory and commercial milestones of up to $297.5 million, which included a $20.0 million non-refundable payment received in the first quarter of 2020, comprised of a $17.5 million payment for EMA approval of fostamatinib for the first indication and a $2.5 million creditable advance royalty payment due upon EMA approval of fostamatinib in the first indication. We will also receive tiered royalty payments ranging from the mid-teens to 30% of net sales of fostamatinib in Europe and Turkey. We retain the global rights to fostamatinib outside the Kissei, Grifols and Medison territories.
In January 2020, we received approval of our MAA for fostamatinib for the treatment of chronic ITP in adult patients who are refractory to other treatments. With this approval, we received a $20.0 million payment as described above. During the regulatory review process, Grifols began preparing to launch the product in the major European markets and is now able to begin the regulatory processes for marketing in the individual countries.
Fostamatinib in Japan/Asia
In October 2018, we entered into an exclusive license and supply agreement with Kissei to develop and commercialize fostamatinib in all current and potential indications in Japan, China, Taiwan and the Republic of Korea. Kissei is a Japan-based pharmaceutical company addressing patients' unmet medical needs through its research, development and commercialization efforts, as well as through collaborations with partners.
Under the terms of the agreement, we received an upfront cash payment of $33.0 million, with the potential for an additional $147.0 million in development and commercial milestone payments, and will receive product transfer price payments in the mid to upper twenty percent range based on tiered net sales for the exclusive supply of fostamatinib. Kissei receives exclusive rights to fostamatinib in ITP and all future indications in Japan, China, Taiwan, and the Republic of Korea. Rigel retains the global rights to fostamatinib outside the Kissei, Grifols and Medison territories.
In September 2019, our collaboration partner, Kissei, initiated a Phase 3 trial in Japan of fostamatinib in adult patients with chronic ITP. The efficacy and safety of orally administered fostamatinib will be assessed by comparing it with placebo in a randomized, double-blind study. Japan has the third highest prevalence of chronic ITP in the world behind the U.S. and EU. In February 2020, Kissei was granted orphan drug designation from the Japanese Ministry of Health, Labour and Welfare for R788 (fostamatinib) in chronic ITP.
Fostamatinib in Canada/Israel
In October 2019, we entered into an exclusive commercialization license agreements with Medison to commercialize fostamatinib in all potential indications in Canada and Israel. Under the terms of the agreements, we will receive an upfront payment of $5.0 million with the potential for approximately $35.0 million in regulatory and commercial milestones. In addition, we will receive royalty payments beginning at 30% of net sales. Under our agreement with Medison for the Canada territory, we have the option to buy back all rights to the product upon regulatory approval in Canada for the indication of AIHA. The buyback provision if exercised would require both parties to mutually agree on commercially reasonable terms for us to purchase back the rights, taking into account Medison’s investment and the value of the rights, among others.
Clinical Stage Programs
Fostamatinib—AIHA
Disease background. AIHA is a rare, serious blood disorder where the immune system produces antibodies that result in the destruction of the body's own red blood cells. Symptoms can include fatigue, shortness of breath, rapid heartbeat, jaundice or enlarged spleen. While no medical treatments are currently approved for AIHA, physicians generally treat acute and chronic cases of the disorder with corticosteroids, other immuno-suppressants, or splenectomy. Research has shown that inhibiting SYK with fostamatinib may reduce the destruction of red blood cells. This disorder affects an estimated 45,000 Americans annually, for whom no approved treatment options currently exist.
Orally available fostamatinib program. We completed our Phase 2 clinical trial, also known as the SOAR study in patients with warm AIHA. This trial was an open-label, multi-center, two-stage study that evaluated the efficacy and safety of fostamatinib in patients with warm AIHA who had previously received treatment for the disorder but have relapsed. The primary efficacy endpoint of this study was to achieve increased hemoglobin levels by week 12 of greater than 10 g/dL, and greater than or equal to 2 g/dL higher than baseline. In November 2019, we announced updated data that in a Phase 2 open-label study of fostamatinib in patients with warm AIHA, data showed that 44% (11/25) of evaluable patients met the primary efficacy endpoint of a Hgb level >10 g/dL with an increase of ≥2 g/dL from baseline by week 24. Including one late responder at week 30, the overall response rate was 48% (12/25). Adverse events were manageable and consistent with those previously reported with fostamatinib.
In March 2019, we initiated our warm AIHA pivotal Phase 3 clinical study of fostamatinib, known as FORWARD study. The clinical trial protocol calls for a placebo-controlled study of approximately 80 patients with primary or secondary warm AIHA who have failed at least one prior treatment. The primary endpoint will be a durable Hgb response on at least 3 visits by week 24, defined as Hgb > 10 g/dL and > 2 g/dL increase from baseline and durability response, with the response not being attributed to rescue therapy.
In May 2019, we enrolled the first patient in the FORWARD study. We have enrolled 41 patients to date. Currently, the FORWARD study has over 80 active clinical trial sites established across 22 countries. A vast majority of these sites have temporarily postponed new patient enrollment due to the ongoing COVID-19 pandemic. As such, we are unable to provide guidance on the timing of enrollment completion. Enrollment is expected to regain momentum as conditions permit across our globally diverse clinical sites.
In January 2018, the FDA granted our request for Orphan Drug designation for fostamatinib for the treatment of AIHA.
R835, an IRAK1/4 Inhibitor for Autoimmune and Inflammatory Diseases
Orally Available IRAK 1/4 Inhibitor Program. During the second quarter of 2018, we selected R835, a proprietary molecule from our IRAK 1/4 preclinical development program, for human clinical trials. This investigational candidate was an orally administered, potent and selective inhibitor of IRAK1 and IRAK4 that blocks inflammatory cytokine production in response to toll-like receptor (TLR) and the interleukin-1 (IL-1R) family receptor signaling. TLRs and IL-1Rs play a critical role in the innate immune response and dysregulation of these pathways can lead to a variety of inflammatory conditions including psoriasis, rheumatoid arthritis, inflammatory bowel disease and gout (among others). R835 prevents cytokine release in response to TLR and IL-1R activation in vitro. R835 is active in multiple rodent models of inflammatory disease including psoriasis, arthritis, lupus, multiple sclerosis and gout. Preclinical studies show that R835 inhibits both the IRAK1 and IRAK4 signaling pathways, which play a key role in inflammation and immune responses to tissue damage. Dual inhibition of IRAK1 and IRAK4 allows for more complete suppression of pro-inflammatory cytokine release.
In October 2019, we announced results from a Phase 1 clinical trial of R835 in healthy subjects to assess safety, tolerability, PK and pharmacodynamics. The Phase 1 study was a randomized, placebo-controlled, double-blind trial in 91 healthy subjects, ages 18 to 55. The Phase 1 trial showed positive tolerability and PK data as well as established
proof-of-mechanism by demonstrating the inhibition of inflammatory cytokine production in response to a lipopolysaccharide (LPS) challenge.
R552, a RIP1 Inhibitor for Autoimmune and Inflammatory Diseases
Orally Available RIP1 Inhibitor Program. R552, is a potent and selective inhibitor of RIP1. RIP1 is believed to play a critical role in induction of necroptosis. Necroptosis is a form of regulated cell death where the rupturing of cells leads to the dispersion of their inner contents, which activates immune responses and enhances inflammation.
Initial data from our ongoing Phase 1 in healthy volunteers suggests that R552 has an attractive PK and safety profile with a half-life of approximately 14 hours which may allow for once a day dosing. In preclinical studies, R552 prevented joint and skin inflammation in a RIP1-mediated murine model of inflammation and tissue damage. In addition, we intend to search for a central nervous system molecule to potentially advance into the clinic.
Partnered Clinical Programs
R548 (ATI-501 and ATI-502) - Aclaris
Aclaris is developing ATI-501 and ATI-502, an oral and topical janus kinase (JAK) 1/3 inhibitor discovered in Rigel’s laboratories. ATI- 501 is being developed as an oral treatment for patients with alopecia areata (AA), including the more severe forms of AA that result in total scalp hair loss, known as alopecia totalis (AT), and total hair loss on the scalp and body, known as alopecia universalis (AU).
In December 2018, Aclaris also reported on the enrollment and/or results for a number of Phase 2 studies with ATI-502 for the topical treatment of AA and Vitiligo, including results from its AUATB-201 study.
In June 2019, Aclaris reported positive results from its Phase 2 clinical trial of ATI-502 topical (AGA-201) in patients with androgenetic alopecia (AGA), a condition commonly known as male/female-pattern baldness. There were no treatment-related serious adverse events. Later in June 2019, Aclaris reported that its Phase 2 clinical trial of ATI-502 topical (AA-201) in patients with AA did not meet its endpoints. ATI-502 was observed to be generally well-tolerated. Adverse events were primarily mild or moderate in severity. No treatment-related serious adverse events were reported.
In July 2019, Aclaris announced that ATI-501 achieved statistically significant improvement over placebo in several measures of hair growth, including the primary endpoint and certain secondary endpoints of this trial. ATI-501 was observed to be generally well-tolerated at all doses. There were no serious adverse events reported. All adverse events (AEs) were mild or moderate in severity and rates of AEs were similar across all groups. No thromboembolic events were observed in the trial.
Aclaris is currently seeking a development and commercialization partner for ATI-501 and ATI-502 as potential treatments for alopecia.
BGB324 - BerGenBio
BerGenBio is conducting Phase 1/2 studies with BGB324 (bemcentinib), a first-in-class selective AXL kinase inhibitor, as a single agent in relapsed acute myeloid leukemia (AML) and myelodysplastic syndrome (MDS); and in combination with erlotinib (Tarceva®) in advanced (EGFR-positive) non-small-cell lung carcinoma. BerGenBio is also conducting Phase 2 studies with BGB324 in combination with KEYTRUDA® (pembrolizumab) in non-small cell adenocarcinoma of the lung and triple negative breast cancer in collaboration with another company.
In November 2019, BerGenBio showed that the primary endpoint of Overall Response Rate (ORR) had been met in Cohort A of its Phase II clinical trial evaluating bemcentinib in combination with KEYTRUDA as a potential new treatment regimen for previously treated advanced non-small cell lung cancer (NSCLC). The primary efficacy endpoint requires that at least 25% evaluable patients achieve a clinical response when treated with the novel drug combination,
defined as either complete or partial response, as measured by Response Evaluation Criteria in Solid Tumors (RECIST). A secondary endpoint of median Progression Free Survival (mPFS) reported significant 3-fold improvement in AXL positive vs negative patients, as defined by BerGenBio’s composite AXL tumor-immune score.
In December 2019, BerGenBio reported results in combination with low-dose cytarabine (LDAC) in elderly AML patients. The bemcentinib-LDAC combination was safe and well tolerated in elderly AML patients. The overall response rate and duration surpass historical benchmarks and compare favorably to other LDAC combinations.
In April 2020, BerGenBio announced that bemcentinib has been selected as the first potential treatment to be fast-tracked in a new UK national multi-center randomized Phase II clinical trial initiative to potentially receive an early indication of bemcentinib’s effectiveness in treating the most vulnerable patients with COVID-19.
DS-3032 - Daiichi
DS-3032 is an investigational oral selective inhibitor of the murine double minute 2 (MDM2) protein currently being investigated by Daiichi in three Phase 1 clinical trials for solid and hematological malignancies including AML, acute lymphocytic leukemia, chronic myeloid leukemia in blast phase, lymphoma and MDS.
Preliminary safety and efficacy data from a Phase 1 study of DS-3032 suggests that DS-3032 may be a promising treatment for hematological malignancies including relapsed/refractory AML and high-risk MDS. Evaluation of additional dosing schedules of DS-3032 is underway and combination studies with fostamatinib are currently being conducted by Daiichi.
AZ-D0449 – AZ
AZ is currently conducting a Phase 1 study in healthy volunteers and patients with mild asthma to investigate the safety, anti-inflammatory effect of inhaled AZ-D0449. The study, which follows the single and multiple ascending doses, is currently recruiting patients.
Research/Preclinical Programs
We are conducting proprietary research in the broad disease areas of inflammation/immunology, immuno-oncology and cancers. Within these disease areas, our researchers are investigating mechanisms of action as well as screening compounds against potential novel targets and optimizing those leads that appear to have the greatest potential.
Commercialization and Sponsored Research and License Agreements
We conduct research and development programs independently and in connection with our corporate collaborators. As of March 31, 2020, we are a party to collaboration agreements with ongoing performance obligations with Kissei Pharmaceutical Co., Ltd. (Kissei) for the development and commercialization of fostamatinib in Japan, China, Taiwan and the Republic of Korea and with Grifols, S.A. (Grifols) to commercialize fostamatinib in all indications, including chronic ITP and AIHA, in Europe and Turkey and with Medison Pharma Ltd. (Medison) to commercialize fostamatinib in all indications, including chronic ITP and AIHA in Canada and Israel. As of March 31, 2020, we are also a party to collaboration agreements, but do not have ongoing performance obligations, with Aclaris for the development and commercialization of JAK inhibitors for the treatment of alopecia areata and other dermatological conditions, AZ for the development and commercialization of R256, an inhaled JAK inhibitor, BerGenBio for the development and commercialization of AXL inhibitors in oncology, and Daiichi to pursue research related to MDM2 inhibitors, a novel class of drug targets called ligases.
Under these agreements, which we entered into in the ordinary course of business, we received or may be entitled to receive upfront cash payments, payments contingent upon specified events achieved by such partners and royalties on any net sales of products sold by such partners under the agreements. Total future contingent payments to us under all of these agreements could exceed $611.7 million if all potential product candidates achieved all of the payment
triggering events under all of our current agreements (based on a single product candidate under each agreement). Of this amount, up to $70.5 million relates to the achievement of development events, up to $165.2 million relates to the achievement of regulatory events and up to $376.0 million relates to the achievement of certain commercial or launch events. This estimated future contingent amount does not include any estimated royalties that could be due to us if the partners successfully commercialize any of the licensed products. Future events that may trigger payments to us under the agreements are based solely on our partners’ future efforts and achievements of specified development, regulatory and/or commercial events.
Due to the COVID-19 pandemic, the commercial launch of fostamatinib in Europe by our partner, Grifols, could be delayed or undertaken in a virtual manner. In addition, our partner, Kissei is currently conducting a Phase 3 clinical trial for fostamatinib in ITP in Japan the timing and completion of which could be delayed due to the COVID-19 pandemic. At this time, however, we cannot fully forecast the scope of impacts that the COVID-19 pandemic may have under these partnerships.
Grifols License Agreement
In January 2019, we entered into an exclusive license agreement with Grifols to commercialize fostamatinib in all indications, including chronic ITP and AIHA, in Europe and Turkey. Under the agreement, we received an upfront payment of $30.0 million, with the potential for $297.5 million in total regulatory and commercial milestones, which included a $20.0 million payment upon approval from the European Medicines Agency (EMA) for fostamatinib in chronic ITP as discussed below. We will also receive stepped double-digit royalty payments based on tiered net sales which may reach 30% of net sales. In return, Grifols will receive exclusive rights to fostamatinib in human diseases, including chronic ITP and AIHA, in Europe and Turkey. The agreement also requires us to conduct the Phase 3 trial in AIHA in the U.S.
In January 2020, we received European Commission’s approval of our MAA for fostamatinib for the treatment of chronic immune thrombocytopenia in adult patients who are refractory to other treatments. With this approval, we received in February 2020 a $20.0 million non-refundable payment, which is comprised of a $17.5 million payment for EMA approval of fostamatinib for the first indication and a $2.5 million creditable advance royalty payment, based on the terms of our collaboration agreement with Grifols. The above milestone payment will be allocated to the distinct performance obligation in the collaboration agreement with Grifols.
We accounted for this agreement under ASC 606 and identified the following distinct performance obligations at inception of the agreement: (a) granting of the license, (b) performance of research and regulatory services related to our ongoing long-term open-label extension study on patients with ITP, and (c) performance of research services related to our Phase 3 study in AIHA. In addition, we will enter into a commercial supply agreement for the licensed territories. We concluded each of these performance obligations is distinct. We based our assessment on the following: (i) our assessment that Grifols can benefit from the license on its own by developing and commercializing the underlying product using its own resources, and (ii) the fact that the manufacturing services are not highly specialized in nature and can be performed by other vendors. Upon execution of our agreement with Grifols, we determined that the upfront fee of $5.0 million, which is the non-refundable portion of the $30.0 million upfront fee, represented the transaction price. In the first quarter of 2020, we revised the transaction price to include the $25.0 million of the upfront payment that is no longer refundable under our agreement and the $20.0 million payment received that is no longer constrained. We allocated the updated transaction price to the distinct performance obligations in our collaboration agreement based on our best estimate of the relative standalone selling price as follows: (a) for the license, we estimated the standalone selling price using the adjusted market assessment approach to estimate its standalone selling price in the licensed territories; (b) for the research and regulatory services, we estimated the standalone selling price using the cost plus expected margin approach. As a result of the adjusted transaction price, adjustments are recorded on a cumulative catch-up basis, and recorded as part of contract revenues from collaborations in the first quarter of 2020.
The remaining future variable consideration of $277.5 million related to future regulatory and commercial milestones were fully constrained due to the fact that it was probable that a significant reversal of cumulative revenue would occur, given the inherent uncertainty of success with these future milestones. We will recognize revenues related
the research and regulatory services throughout the term of the respective clinical programs using the input method. For sales-based milestones and royalties, we determined that the license is the predominant item to which the royalties or sales-based milestones relate. Accordingly, we will recognize revenue at the later of (i) when the related sales occur, or (ii) when the performance obligation to which some or all of the royalty has been allocated has been satisfied (or partially satisfied). We will re-evaluate the transaction price in each reporting period and as uncertain events are resolved or other changes in circumstances occur.
During the three months ended March 31, 2020, we recognized $39.9 million in revenues related to the licensed rights in intellectual property and $3.2 million in revenues related to the research services performed. Deferred revenues as of March 31, 2020 was $2.2 million.
Kissei License Agreement
In October 2018, we entered into an exclusive license and supply agreement with Kissei to develop and commercialize fostamatinib in all current and potential indications in Japan, China, Taiwan and the Republic of Korea. Kissei is responsible for performing and funding all development activities for fostamatinib in the above-mentioned territories. We received an upfront cash payment of $33.0 million, with the potential for up to an additional $147.0 million in development, regulatory and commercial milestone payments, and will receive mid to upper twenty percent, tiered, escalated net sales-based payments for the supply of fostamatinib. Under the agreement, we granted Kissei the license rights to fostamatinib in the territories above and are obligated to supply Kissei with drug product for use in clinical trials and pre-commercialization activities. We are also responsible for the manufacture and supply of fostamatinib for all future development and commercialization activities under the agreement.
We accounted for this agreement under ASC 606 and identified the following distinct performance obligations at inception of the agreement: (a) granting of the license, (b) supply of fostamatinib for clinical use and (c) material right associated with discounted fostamatinib that are supplied for use other than clinical or commercial. In addition, we will provide commercial product supply if the product is approved in the licensed territory. We concluded that each of these performance obligations is distinct. We based our assessment on the following: (i) our assessment that Kissei can benefit from the license on its own by developing and commercializing the underlying product using its own resources and (ii) the fact that the manufacturing services are not highly specialized in nature and can be performed by other vendors. Moreover, we determined that the upfront fee of $33.0 million represented the transaction price and was allocated to the performance obligations based on our best estimate of the relative standalone selling price as follows: (a) for the license, we estimated the standalone selling price using the adjusted market assessment approach to estimate its standalone selling price in the licensed territories; (b) for the supply of fostamatinib and the material right associated with discounted fostamatinib, we estimated the standalone selling price using the cost plus expected margin approach. Variable consideration of $147.0 million related to future development and regulatory milestones was fully constrained due to the fact that it was probable that a significant reversal of cumulative revenue would occur, given the inherent uncertainty of success with these future milestones. We will recognize revenues related to the supply of fostamatinib and material right upon delivery of fostamatinib to Kissei. For sales-based milestones and royalties, we determined that the license is the predominant item to which the royalties or sales-based milestones relate to. Accordingly, we will recognize revenue at the later of (i) when the related sales occur, or (ii) when the performance obligation to which some or all of the royalty has been allocated has been satisfied (or partially satisfied). We will re-evaluate the transaction price in each reporting period and as uncertain events are resolved or other changes in circumstances occur.
We did not recognize any revenues during the three months ended March 31, 2020. At March 31, 2020, deferred revenues related to the unsatisfied performance obligations related to the supply of fostamatinib and material right associated with discounted fostamatinib supply was $1.4 million.
Other license agreements
As of March 31, 2020, we have accounts receivable of $1.0 million relative to the first amendment to the license and collaboration agreement with Aclaris executed in the fourth quarter of 2019, of which $500,000 was received in April 2020.
In October 2019, we entered into two exclusive commercial and license agreements with Medison for the commercialization of fostamatinib for chronic ITP in Israel and in Canada pursuant to which we received a $5.0 million upfront payment under our agreement in Canada. We accounted for the agreement made with an upfront payment under ASC 606 and identified the following combined performance obligations at inception of the agreement: (a) granting of the license and (b) obtaining regulatory approval in Canada of fostamatinib in ITP. We determined that the non-refundable upfront fee of $5.0 million represented the transaction price. However, under the agreement, we have the option to buy back all rights to the product in Canada within six months that we obtain regulatory approval in Canada of the product for the indication of AIHA. The buyback option precludes us from transferring control of the license to Medison under ASC 606. We believe that the buyback provision, if exercised, will require us to repurchase the license at an amount equal to or more than the upfront $5.0 million. As such this arrangement is accounted for as a financing arrangement. Accrued interest related to this financing arrangement as of March 31, 2020 is immaterial.
Results of Operations
Three Months Ended March 31, 2020
Revenues
|
|
|
|
|
|
|
|
|
|
|
|
|
|
|
|
Three Months Ended
|
|
|
|
|
|
|
|
|
March 31,
|
|
Aggregate
|
|
|
|
|
|
2020
|
|
2019
|
|
Change
|
|
|
|
|
|
|
|
|
(in thousands)
|
|
|
|
|
|
|
Product sales, net
|
|
$
|
12,680
|
|
$
|
8,054
|
|
$
|
4,626
|
|
|
|
Contract revenues from collaborations
|
|
|
43,081
|
|
|
4,570
|
|
|
38,511
|
|
|
|
Total revenues
|
|
$
|
55,761
|
|
$
|
12,624
|
|
$
|
43,137
|
|
|
The following table summarizes revenues from each of our customers and collaboration partners who individually accounted for 10% or more of our total revenues (as a percentage of total revenues):
|
|
|
|
|
|
|
|
|
|
|
|
|
Three Months Ended
|
|
|
|
|
|
March 31,
|
|
|
|
|
|
2020
|
|
2019
|
|
|
|
Grifols
|
|
|
77%
|
|
|
36%
|
|
|
|
ASD Healthcare and Oncology Supply
|
|
|
12%
|
|
|
33%
|
|
|
|
McKesson Specialty Care Distribution Corporation
|
|
|
9%
|
|
|
24%
|
|
|
|
|
|
|
|
|
|
|
|
|
Product sales during the three months ended March 31, 2020 and 2019 related to sales of TAVALISSE in the U.S. and represent increasing sales volume since we launched in May 2018. For the three months ended March 31, 2020, the increase in product sales was mainly due to TAVALISSE sales volume increase of 37% compared to the same period in 2019, as well as increases in the selling price of TAVALISSE. TAVALISSE has been prescribed across all lines of therapy in steroid refractory patients in ITP. It has been utilized by an increasing broad base of prescribers and community physicians, with growing early line use and continued strong refill rates.
We recognize product sales, net of discounts and allowances, that are described in “Note 3” to our “Notes to Condensed Financial Statements” contained in Part I, Item 1 of this Quarterly Report on Form 10-Q.
Contract revenues from collaborations of $43.1 million in the first quarter of 2020 relate to revenue from the upfront fee we previously received from Grifols in the first quarter of 2019, as well as the milestone payment received from Grifols in the first quarter of 2020 upon EC approval of the MAA for fostamatinib in Europe. For the same period in 2019, we recognized contract revenues of $4.6 million primarily from the $4.4 million of the $30.0 million upfront fee recognized as revenue upon delivery of license rights to Grifols and our performance of certain research and development services.
Our potential future revenues may include product sales from TAVALISSE, payments from our current partners and from new partners with whom we enter into agreements in the future, if any, the timing and amount of which is unknown at this time. We cannot currently fully forecast the extent of the impacts that the COVID-19 pandemic may have on our product sales. As of March 31, 2020, we had deferred revenues of $3.6 million which we will recognize as revenue upon satisfaction of our remaining performance obligations under our collaboration agreements with Grifols and Kissei.
Cost of Product Sales
|
|
|
|
|
|
|
|
|
|
|
|
|
|
|
|
Three Months Ended
|
|
|
|
|
|
|
|
March 31,
|
|
Aggregate
|
|
|
|
|
|
2020
|
|
2019
|
|
Change
|
|
|
|
|
|
|
|
|
(in thousands)
|
|
|
|
|
|
|
Cost of product sales
|
|
$
|
155
|
|
$
|
107
|
|
$
|
48
|
|
|
We recognized $155,000 and $107,000 in cost of product sales during the three months ended March 31, 2020 and 2019, respectively, related to our product, TAVALISSE. Prior to the FDA approval, manufacturing and related costs were charged to research and development expense. Therefore, these costs were not capitalized and as a result, are not fully reflected in the costs of product sales during the three months ended March 31, 2020 and 2019. We will continue to have a lower cost of product sales that excludes the cost of the active pharmaceutical product that was produced prior to FDA approval until we sell TAVALISSE that includes newly manufactured API. We expect that this will be the case for the near-term and as a result, our cost of product sales will be less than we anticipate it will be in future periods. As we produce TAVALISSE in the future, our inventory cost in the Balance Sheet and Cost of Product Sales will increase reflecting the full cost of manufacturing.
Research and Development Expense
|
|
|
|
|
|
|
|
|
|
|
|
|
|
|
|
Three Months Ended
|
|
|
|
|
|
|
|
|
March 31,
|
|
Aggregate
|
|
|
|
|
|
2020
|
|
2019
|
|
Change
|
|
|
|
|
|
|
|
|
(in thousands)
|
|
|
|
|
|
|
Research and development expense
|
|
$
|
16,149
|
|
$
|
10,949
|
|
$
|
5,200
|
|
|
|
Stock-based compensation expense included in research and development expense
|
|
$
|
694
|
|
$
|
787
|
|
$
|
(93)
|
|
|
The increase in research and development expense for the three months ended March 31, 2020, compared to the same period in 2019, was primarily due to the $5.0 million ramp up in research and development cost for our on-going Phase 3 study in warm AIHA, Phase 1 study of our RIP1 inhibitor program and Phase 1 study in our IRAK 1/4 inhibitor program, as well as consultants and outside services of $300,000 and personnel-related expenses of $100,000 partially offset by a decrease of $200,000 in various third-party costs.
We expect our research and development expense in the remainder of 2020 will increase as we continue our activities in our Phase 3 warm AIHA studies and RIP1 and IRAK 1/4 programs. Although a vast majority of the clinical trial sites for our FORWARD study for warm AIHA have temporarily postponed new patient enrollment due to the ongoing COVID-19 pandemic, we expect to continue to incur expenses in managing the study and expenses related to measures to implement remote and virtual approaches, including remote patient monitoring and other alternative course of actions to maintain our study in warm AIHA. We cannot currently fully forecast the scope of impacts that the COVID-19 pandemic may have on our ability to continue to initiate trial sites, continue to treat patients enrolled in our trials, enroll and assess new patients, supply study drug, obtain complete data points in accordance with the study protocol, and overall impact on clinical study results including the timing thereof.
Our research and development expenditures include costs related to preclinical and clinical trials, scientific personnel, supplies, equipment, consultants, sponsored research, stock-based compensation, and allocated facility costs.
We do not track fully burdened research and development costs separately for each of our drug candidates. We review our research and development expenses by focusing on three categories: research, development, and other. Our research team is focused on creating a portfolio of product candidates that can be developed into small molecule therapeutics in our own proprietary programs or with potential collaborative partners and utilizes our robust discovery engine to rapidly discover and validate new product candidates in our focused range of therapeutic indications. “Research” expenses relate primarily to personnel expenses, lab supplies, fees to third party research consultants and compounds. Our development group leads the implementation of our clinical and regulatory strategies and prioritizes disease indications in which our compounds may be studied in clinical trials. “Development” expenses relate primarily to clinical trials, personnel expenses, costs related to the submission and management of our NDA, lab supplies and fees to third party research consultants. “Other” expenses primarily consist of allocated facilities costs and allocated stock-based compensation expense relating to personnel in research and development groups.
In addition to reviewing the three categories of research and development expenses described in the preceding paragraph, we principally consider qualitative factors in making decisions regarding our research and development programs, which include enrollment in clinical trials and the results thereof, the clinical and commercial potential for our drug candidates and competitive dynamics. We also make our research and development decisions in the context of our overall business strategy, which includes the evaluation of potential collaborations for the development of our drug candidates.
We do not have reliable estimates regarding the timing of our clinical trials. Preclinical testing and clinical development are long, expensive and uncertain processes. In general, biopharmaceutical development involves a series of steps, beginning with identification of a potential target and including, among others, proof of concept in animals and Phase 1, 2 and 3 clinical trials in humans. Significant delays in clinical testing could materially impact our product development costs and timing of completion of the clinical trials. We do not know whether planned clinical trials will begin on time, will need to be halted or revamped or will be completed on schedule, or at all. Clinical trials can be delayed for a variety of reasons, including delays in obtaining regulatory approval to commence a trial, delays from scale up, delays in reaching agreement on acceptable clinical trial agreement terms with prospective clinical sites, delays in obtaining institutional review board approval to conduct a clinical trial at a prospective clinical site or delays in recruiting subjects to participate in a clinical trial.
We currently do not have reliable estimates of total costs for a particular drug candidate to reach the market. Our potential products are subject to a lengthy and uncertain regulatory process that may involve unanticipated additional clinical trials and may not result in receipt of the necessary regulatory approvals. Failure to receive the necessary regulatory approvals would prevent us from commercializing the product candidates affected. In addition, clinical trials of our potential products may fail to demonstrate safety and efficacy, which could prevent or significantly delay regulatory approval.
The following table presents our total research and development expense by category (in thousands).
|
|
|
|
|
|
|
|
|
|
|
|
|
|
|
|
Three Months Ended
|
|
|
|
|
|
|
|
March 31,
|
|
|
From January 1, 2007*
|
|
|
|
|
2020
|
|
2019
|
|
|
to March 31, 2020
|
|
|
|
|
|
|
|
|
|
|
|
|
|
|
|
Categories:
|
|
|
|
|
|
|
|
|
|
|
|
|
Research
|
|
$
|
2,675
|
|
$
|
2,659
|
|
|
$
|
246,730
|
|
|
Development
|
|
|
11,241
|
|
|
5,907
|
|
|
|
405,004
|
|
|
Other
|
|
|
2,233
|
|
|
2,383
|
|
|
|
246,915
|
|
|
|
|
$
|
16,149
|
|
$
|
10,949
|
|
|
$
|
898,649
|
|
*We started tracking research and development expense by category on January 1, 2007.
“Other” expenses mainly represent allocated facilities costs of approximately $1.5 million and $1.6 million for the three months ended March 31, 2020 and 2019, respectively and allocated stock-based compensation expense of approximately $694,000 and $787,000 for the three months ended March 31, 2020 and 2019, respectively.
For the three months ended March 31, 2020 and 2019, a major portion of our total research and development expense was associated with our AIHA, RIP1, and IRAK programs, salaries of our research and development personnel and allocated facilities costs.
Selling, General and Administrative Expense
|
|
|
|
|
|
|
|
|
|
|
|
|
|
|
|
Three Months Ended
|
|
|
|
|
|
|
|
|
March 31,
|
|
Aggregate
|
|
|
|
|
|
2020
|
|
2019
|
|
Change
|
|
|
|
|
|
|
|
|
(in thousands)
|
|
|
|
|
|
|
Selling, general and administrative expense
|
|
$
|
18,430
|
|
$
|
19,946
|
|
$
|
(1,516)
|
|
|
|
Stock-based compensation expense included in selling, general and administrative expense
|
|
$
|
1,330
|
|
$
|
2,166
|
|
$
|
(836)
|
|
|
The decrease in selling, general and administrative expense for the three months ended March 31, 2020 compared to the same period in 2019, was primarily due to reduction of $836,000 in stock-based compensation expense, $625,000 of costs related to our customer-facing team, consultants and outside services, and $500,000 of legal fees, partially offset by an increase of $400,000 for various expense items.
We expect our selling, general and administrative expense to increase as we continue to expand our commercial activities for TAVALISSE. As discussed above, resources have been deployed to enable our field-based employees to continue to engage remotely with healthcare providers during the ongoing COVID-19 pandemic. These virtual engagements have enabled our field team to support existing prescribers as well as partner with new prescribers to identify appropriate patients for TAVALISSE. However, we are not currently able to fully forecast the scope of impacts that the COVID-19 pandemic may have on our commercial activities and sales of TAVALISSE.
Interest Income
|
|
|
|
|
|
|
|
|
|
|
|
|
|
|
|
Three Months Ended
|
|
|
|
|
|
|
|
March 31,
|
|
Aggregate
|
|
|
|
|
|
2020
|
|
2019
|
|
Change
|
|
|
|
|
|
|
|
|
(in thousands)
|
|
|
|
|
|
|
Interest income
|
|
$
|
358
|
|
$
|
780
|
|
$
|
(422)
|
|
|
Interest income results from our interest-bearing cash and investment balances. The decrease in interest income for the three months ended March 31, 2020 as compared to the same period in 2019 was primarily due to decrease in yield on our investments, as well as our average cash and investment balances.
Interest Expense
|
|
|
|
|
|
|
|
|
|
|
|
|
|
|
|
Three Months Ended
|
|
|
|
|
|
|
|
March 31,
|
|
Aggregate
|
|
|
|
|
|
2020
|
|
2019
|
|
Change
|
|
|
|
|
|
|
|
|
(in thousands)
|
|
|
|
|
|
|
Interest expense
|
|
$
|
(142)
|
|
$
|
—
|
|
$
|
(142)
|
|
|
Interest expense for the three months ended March 31, 2020 was related to the outstanding balance on our term loan from Midcap. We expect interest expense to increase given the additional tranche of $10.0 million funded in May 2020.
Critical Accounting Policies and the Use of Estimates
Our discussion and analysis of our financial condition and results of operations is based upon our financial statements, which have been prepared in accordance with U.S. generally accepted accounting principles (U.S. GAAP). The preparation of these financial statements requires us to make estimates and assumptions that affect the amounts reported in the financial statements and accompanying notes. On an ongoing basis, we evaluate our estimates, including any potential impact of the COVID-19 pandemic to the carrying values of our assets and liabilities, those related to revenue recognition on product sales and collaboration agreements, recoverability of our assets, including accounts receivables and inventories, stock-based compensation, the probability of achievement of corporate performance-based milestone for our performance-based stock option awards, impairment issues, the estimated useful life of assets, estimated accruals, particularly research and development accruals, and estimates related our valuation of the operating lease right-of-use asset and lease liability, including the incremental borrowing rate used. We base our estimates on historical experience and on various other assumptions that we believe to be reasonable under the circumstances, the results of which form the basis for making judgments about the carrying values of assets and liabilities that are not readily apparent from other sources. Actual results may differ from these estimates under different assumptions or conditions. We believe that there have been no significant changes in our critical accounting policies and estimates disclosed in our Annual Report on Form 10-K for the year ended December 31, 2019, as filed with the SEC.
Recent Accounting Pronouncements
For a discussion of new accounting pronouncements, see “Note 3” to our “Notes to Condensed Financial Statements” contained in Part I, Item 1 of this Quarterly Report on Form 10-Q.
Liquidity and Capital Resources
Cash Requirements
From inception, we have financed our operations primarily through sales of equity securities, contract payments under our collaboration agreements and from sales of TAVALISSE beginning in May 2018. We have consumed substantial amounts of capital to date as we continue our research and development activities, including preclinical studies and clinical trials and our ongoing commercial launch of TAVALISSE.
As of March 31, 2020, we had approximately $95.9 million in cash, cash equivalents and short‑term investments, as compared to approximately $98.1 million as of December 31, 2019, a decrease of approximately $1.7 million. The decrease was primarily attributable to payments associated with funding our operating expenses during the three months ended March 31, 2020.
In September 2019, we entered into a $60.0 million term loan credit facility with MidCap. At closing,
$10.0 million was funded to us in an initial tranche. We accessed the second $10.0 million tranche from our term loan credit facility with MidCap which we received in May 2020. The facility provides the company with access to an additional $40.0 million which is subject to the achievement of certain customary conditions.
In October 2018, we entered into an exclusive license and supply agreement with Kissei to develop and commercialize fostamatinib in all current and potential indications in Japan, China, Taiwan and the Republic of Korea, in which we received an upfront payment of $33.0 million. In January 2019, we entered into an exclusive commercialization license agreement with Grifols to commercialize fostamatinib for the treatment, palliation, or prevention of human diseases, including chronic or persistent ITP, AIHA, and IgAN in Europe and Turkey, in which we received an upfront payment of $30.0 million, with the potential for $297.5 million in payments related to regulatory and commercial milestones, which includes a $20.0 million payment received in February 2020, comprised of a $17.5 million for EMA approval of fostamatinib for the first indication and a $2.5 million creditable advance royalty payment due upon EMA approval of fostamatinib in the first indication in chronic ITP. We will also receive stepped double-digit royalty payments based on tiered net sales which may reach 30% of net sales of fostamatinib. In return, Grifols receives
exclusive rights to fostamatinib in human diseases, including chronic ITP and AIHA in Europe and Turkey. We retain the global rights to fostamatinib outside the Kissei, Grifols and Medison territories.
In December 2014, we entered into a sublease agreement with an unrelated third party to occupy a portion of our research and office space. This sublease agreement was amended in February 2017 to sublease additional research and office space. Effective July 2017, the sublease agreement was amended primarily to extend the term of the sublease through January 2023. During the three months ended March 31, 2020, we received approximately $1.3 million of sublease income and reimbursements. We expect to receive approximately $12.9 million in future sublease income (excluding our subtenant’s share of facility’s operating expenses) through January 2023.
We believe that our existing capital resources will be sufficient to support our current and projected funding requirements, including the ongoing commercial launch of TAVALISSE in the U.S., through at least the next 12 months from the filing date of this report. We have based this estimate on assumptions that may prove to be wrong, and we could utilize our available capital resources sooner than we currently expect. Because of the numerous risks and uncertainties associated with commercial launch, the development of our product candidates and other research and development activities, we are unable to estimate with certainty our future product revenues, our revenues from our current and future collaborative partners, the amounts of increased capital outlays and operating expenditures associated with our current and anticipated clinical trials and other research and development activities.
Our operations will require significant additional funding for the foreseeable future. Unless and until we are able to generate a sufficient amount of product, royalty or milestone revenue, we expect to finance future cash needs through public and/or private offerings of equity securities, debt financings and/or collaboration and licensing arrangements, and to a much lesser extent through the proceeds from exercise of stock options and interest income earned on the investment of our excess cash balances and short-term investments. However, the COVID-19 pandemic continues to rapidly evolve and has already resulted in a significant disruption of global financial markets. Our ability to raise additional capital may be adversely impacted by potential worsening of global economic conditions and the recent disruptions to, and volatility in, the credit and financial markets in the U.S. and worldwide resulting from the pandemic. If the disruption persists and deepens, we could experience an inability to access additional capital, which could in the future negatively affect our capacity for certain corporate development transactions or our ability to make important, opportunistic investments. In addition, any additional capital we raise by issuing equity securities, our stockholders could at that time experience substantial dilution. Our current credit facility with MidCap and any debt financing that we are able to obtain in the future may involve operating covenants that may restrict our business. To the extent that we raise additional funds through collaboration and licensing arrangements, we may be required to relinquish some of our rights to our technologies or product candidates or grant licenses on terms that are not favorable to us.
Our future funding requirements will depend upon many factors, including, but not limited to:
|
·
| |
the ongoing costs to commercialize TAVALISSE for the treatment of ITP in the U.S., or any other future product candidates, if any such candidate receives regulatory approval for commercial sale; |
|
·
| |
the progress and success of our clinical trials and preclinical activities (including studies and manufacture of materials) of our product candidates conducted by us; |
|
·
| |
our ability to meet operating covenants under our current and future credit facilities, if any; |
|
·
| |
our ability to enter into partnering opportunities across our pipeline within and outside the U.S.; |
|
·
| |
the costs and timing of regulatory filings and approvals by us and our collaborators; |
|
·
| |
the progress of research and development programs carried out by us and our collaborative partners; |
|
·
| |
any changes in the breadth of our research and development programs; |
|
·
| |
the ability to achieve the events identified in our collaborative agreements that may trigger payments to us from our collaboration partners; |
|
·
| |
our ability to acquire or license other technologies or compounds that we may seek to pursue; |
|
·
| |
our ability to manage our growth; |
|
·
| |
competing technological and market developments; |
|
·
| |
the costs and timing of obtaining, enforcing and defending our patent and other intellectual property rights; and |
|
·
| |
expenses associated with any unforeseen litigation, including any arbitration and securities class action lawsuits. |
Insufficient funds may require us to delay, scale back or eliminate some or all of our commercial efforts and/or research or development programs, to lose rights under existing licenses or to relinquish greater or all rights to product candidates at an earlier stage of development or on less favorable terms than we would otherwise choose or may adversely affect our ability to operate as a going concern.
For the three months ended March 31, 2020 and 2019, we maintained an investment portfolio primarily in money market funds, U. S. treasury bills, government‑sponsored enterprise securities, and corporate bonds and commercial paper. Cash in excess of immediate requirements is invested with regard to liquidity and capital preservation. Wherever possible, we seek to minimize the potential effects of concentration and degrees of risk. We will continue to monitor the impact of the changes in the conditions of the credit and financial markets to our investment portfolio and assess if future changes in our investment strategy are necessary.
Cash Flows from Operating, Investing and Financing Activities
|
|
|
|
|
|
|
|
|
|
|
|
Three Months Ended March 31,
|
|
|
|
|
2020
|
|
2019
|
|
|
|
|
(in thousands)
|
|
|
Net cash provided by (used in):
|
|
|
|
|
|
|
|
|
Operating activities
|
|
$
|
(3,093)
|
|
$
|
(569)
|
|
|
Investing activities
|
|
|
24,461
|
|
|
(1,073)
|
|
|
Financing activities
|
|
|
1,336
|
|
|
16
|
|
|
Net (decrease) increase in cash and cash equivalents
|
|
$
|
22,704
|
|
$
|
(1,626)
|
|
Net cash used in operating activities was approximately $3.1 million for the three months ended March 31, 2020, compared to approximately $569,000 for the three months ended March 31, 2019. Net cash used in operating activities for the three months ended March 31, 2020 was related to our research and development programs and our ongoing commercialization of TAVALISSE, partially offset by the $20.0 million payment received from Grifols and proceeds from sale of TAVALISSE. Net cash used in operating activities for the three months ended March 31, 2019 was related to our research and development programs and our commercialization of TAVALISSE partially offset by the $30.0 million upfront fee received from Grifols. The timing of cash requirements may vary from period to period depending on our ongoing commercial activities related to TAVALISSE, timing of collaboration revenues, our ability to access additional funds from our credit facility with MidCap, our research and development activities, including our planned preclinical and clinical trials, and future requirements to establish commercial capabilities for any products that we may develop.
Net cash provided by investing activities was approximately $24.5 million for the three months ended March 31, 2020, compared to net cash used in investing activities of approximately $1.1 million for the three months ended March 31, 2019. Net cash provided by investing activities during the three months ended March 31, 2020 related to net
maturities of short-term investments, partially offset by capital expenditures. Net cash used in investing activities during the three months ended March 31, 2019 related to net purchases of short-term investments and capital expenditures. Capital expenditures were approximately $607,000 for the three months ended March 31, 2020, compared to approximately $377,000 for the same period in 2019.
Net cash provided by financing activities was approximately $1.3 million for the three months ended March 31, 2020, compared to approximately $16,000 for the three months ended March 31, 2019. Net cash provided by financing activities for the three months ended March 31, 2020 and 2019 related to the proceeds from exercise of stock options.
Off-Balance Sheet Arrangements
As of March 31, 2020, we had no off-balance sheet arrangements (as defined in Item 303(a)(4)(ii) of Regulation S-K under the Exchange Act).
Contractual Obligations
We conduct our commercial activities and research and development programs internally and through third parties that include, among others, arrangements with collaboration partners, vendors, consultants, contract research organizations (CRO) and universities. We have contractual arrangements with these parties, however our contracts with them are cancelable generally on reasonable notice within one year and our obligations under these contracts are primarily based on services performed. We do not have any purchase commitments under any collaboration arrangements.
We have agreements with certain clinical research organizations to conduct our clinical trials and with third parties relative to our commercialization of TAVALISSE. The timing of payments for any amounts owed under the respective agreements will depend on various factors including, but not limited to, patient enrollment and other progress of the clinical trial and various activities related to commercial launch. We will continue to enter into contracts in the normal course of business with various third parties who support our clinical trials, support our preclinical research studies, and provide other services related to our operating purposes as well as our commercial launch of TAVALISSE. We can terminate these agreements at any time, and if terminated, we would not be liable for the full amount of the respective agreements. Instead, we will be liable for services provided through the termination date plus certain cancellation charges, if any, as defined in each of the respective agreements. In addition, these agreements may, from time to time, be subjected to amendments as a result of any change orders executed by the parties. As of September 30, 2019, we do not have material contractual commitments with respect to the arrangements discussed above, but we had the following contractual commitments related to our facilities lease and credit facility:
|
|
|
|
|
|
|
|
|
|
|
|
|
|
|
|
|
|
|
|
|
|
|
|
Less than
|
|
Payment Due By Period
|
|
More than
|
|
|
|
|
Total
|
|
1 Year
|
|
1 - 3 Years
|
|
3 - 5 Years
|
|
5 Years
|
|
|
|
|
(in thousands)
|
|
|
Facilities lease (1)
|
|
$
|
28,738
|
|
$
|
7,294
|
|
$
|
20,567
|
|
$
|
877
|
|
$
|
—
|
|
|
Credit facility with MidCap (2)
|
|
|
12,803
|
|
|
811
|
|
|
6,097
|
|
|
5,895
|
|
|
—
|
|
|
Total
|
|
$
|
41,541
|
|
$
|
8,105
|
|
$
|
26,664
|
|
$
|
6,772
|
|
$
|
—
|
|
|
(1)
| |
In December 2014, we entered into a sublease agreement, which was amended in 2017, with an unrelated third party to lease up a portion of the research and office space. The facilities lease obligations above do not include the sublease income of approximately $12.9 million which we expect to receive over the term of the sublease through January 2023. |
|
(2)
| |
In September 2019, we entered into a Credit Agreement with MidCap. We received funding for the first tranche of $10.0 million. In March 2020, we accessed the second $10.0 million tranche from our term loan credit facility with MidCap which we received in May 2020 and is not included in the above table. Under the agreement, we are obligated to make interest payments at an annual rate of one-month LIBOR plus 5.65% for |
the first 24 months and the interest plus principal amortization for the next 36 months. We will be obligated to pay administrative fees annually and a final fee upon final payment. |
We are also subject to claims related to the patent protection of certain of our technologies, as well as purported securities class action lawsuit, other litigations, and other contractual agreements. We are required to assess the likelihood of any adverse judgments or outcomes to these matters as well as potential ranges of probable losses. A determination of the amount of reserves required, if any, for these contingencies is made after careful analysis of each individual matter.
Item 3.Quantitative and Qualitative Disclosures About Market Risk
During the three months ended March 31, 2020, there were no material changes to our market risk disclosures as set forth in Part II, Item 7A, “Quantitative and Qualitative Disclosures About Market Risk,” of our Annual Report on Form 10-K for the year ended December 31, 2019.
Item 4.Controls and Procedures
Evaluation of Disclosure Controls and Procedures. Based on the evaluation of our disclosure controls and procedures (as defined in Rules 13a-15(e) and 15d-15(e) under the Exchange Act), our chief executive officer (who serves as our principal executive officer) and our chief financial officer (who serves as our principal financial officer) have concluded that, as of the end of the period covered by this report, our disclosure controls and procedures were effective.
Changes in Internal Controls. There were no changes in our internal control over financial reporting that occurred during the quarter ended March 31, 2020 that have materially affected, or are reasonably likely to materially affect, our internal control over financial reporting.
Limitations on the Effectiveness of Controls. A control system, no matter how well conceived and operated, can provide only reasonable, not absolute, assurance that the objectives of the controls are met. Because of the inherent limitations in all control systems, no evaluation of controls can provide absolute assurance that all control issues, if any, within a company have been detected. Accordingly, our disclosure controls and procedures are designed to provide reasonable, not absolute, assurance that the objectives of our disclosure control system are met and, as set forth above, our chief executive officer and chief financial officer have concluded, based on their evaluation as of the end of the period covered by this report, that our disclosure controls and procedures were sufficiently effective to provide reasonable assurance that the objectives of our disclosure control system were met.
PART II. OTHER INFORMATION
Item 1. Legal Proceedings
None.
Item 1A.Risk Factors
In evaluating our business, you should carefully consider the following risks, as well as the other information contained in this Quarterly Report on Form 10-Q. These risk factors could cause our actual results to differ materially from those contained in forward-looking statements we have made in this Quarterly Report on Form 10-Q and those we may make from time to time. If any of the following risks actually occurs, our business, financial condition and operating results could be harmed. The risks and uncertainties described below are not the only ones facing us. Additional risks and uncertainties not presently known to us, or that we currently see as immaterial, may also harm our business.
We have marked with an asterisk (*) those risk factors below that reflect a substantive change from the risk factors included in our Annual Report on Form 10-K filed with the Securities and Exchange Commission on February 27, 2020.
Our prospects are highly dependent on our first commercial product, TAVALISSE (fostamatinib disodium hexahydrate). To the extent that the commercial success of TAVALISSE in the United States is diminished or is not commercially successful when launched in Europe, our business, financial condition and results of operations may be adversely affected, and the price of our common stock may decline.*
TAVALISSE is our only drug that has been approved for sale in the United States and Europe for patients with chronic ITP. We are focusing a significant portion of our activities and resources on fostamatinib, and we believe our prospects are highly dependent on, and a significant portion of the value of our company relates to, our ability to sustain successful commercialization of TAVALISSE in the United States. We have entered into an exclusive commercialization agreement with Grifols to commercialize fostamatinib in Europe.
Sustained successful commercialization of TAVALISSE is subject to many risks and uncertainties, including the potential impacts of the COVID-19 pandemic on the successful commercialization in the United States, which is still at an early stage, as well as its commercial launch in Europe through our partner, Grifols. We have never, as an organization, launched or commercialized a product, and there is no guarantee that we will be able to continue to do so successfully with fostamatinib for its approved indication. In addition, our partner, Grifols, is responsible for the commercial launch of TAVLESSE in Europe, and we cannot be certain if Grifols will be successful. There are numerous examples of unsuccessful product launches and failures to meet high expectations of market potential, including by pharmaceutical companies with more experience and resources than us.
As we continue to build out our commercial team, there are many factors that could cause the commercialization of TAVALISSE to be unsuccessful, including a number of factors that are outside our control. The commercial success of TAVALISSE depends on the extent to which patients and physicians accept and adopt TAVALISSE for patients with chronic ITP who have had an insufficient response to a previous treatment. We also do not know how physicians, patients and payors will respond to our future price increases of TAVALISSE. Physicians may not prescribe TAVALISSE and patients may be unwilling to use TAVALISSE if coverage is not provided or reimbursement is inadequate to cover a significant portion of the cost. Additionally, any negative development for fostamatinib in clinical development in additional indications, may adversely impact the commercial results and potential of fostamatinib. Thus, significant uncertainty remains regarding the commercial potential of fostamatinib.
Market acceptance of fostamatinib will depend on a number of factors, including:
|
·
| |
the timing of market introduction of the product as well as competitive products; |
|
·
| |
the clinical indications for which the product is approved; |
|
·
| |
acceptance by physicians, the medical community and patients of the product as a safe and effective treatment; |
|
·
| |
impacts due to the ongoing COVID-19 pandemic; |
|
·
| |
the ability to distinguish safety and efficacy from existing, less expensive generic alternative therapies, if any; |
|
·
| |
the convenience of prescribing, administrating and initiating patients on the product and the length of time the patient is on the product; |
|
·
| |
the potential and perceived value and advantages of the product over alternative treatments; |
|
·
| |
the cost of treatment in relation to alternative treatments, including any similar generic treatments; |
|
·
| |
the availability of coverage and adequate reimbursement and pricing by third-party payors and government authorities; |
|
·
| |
the prevalence and severity of adverse side effects; and |
|
·
| |
the effectiveness of sales and marketing efforts. |
If we are unable to sustain anticipated level of sales growth from TAVALISSE, or if we fail to achieve anticipated product royalties and collaboration milestones, we may need to reduce our operating expenses, access other sources of cash or otherwise modify our business plans, which could have a negative impact on our business, financial condition and results of operations.
We also may not be successful entering into arrangements with third parties to sell and market one or more of our product candidates or may be unable to do so on terms that are favorable to us. We likely will have little control over such third parties, including Kissei’s development and commercialization of fostamatinib in all indications in Japan, China, Taiwan, and the Republic of Korea, Grifols’ commercialization of fostamatinib in Europe and Turkey and Medison for future commercialization of fostamatinib in Canada and Israel. As a consequence of our license agreements with Kissei, Grifols and Medison, we rely heavily upon their regulatory, commercial, medical affairs, market access and other expertise and resources for commercialization of TAVALISSE in their respective territories outside of the United States. We cannot control the amount of resources that our partners dedicate to the commercialization of TAVALISSE, and our ability to generate revenues from the commercialization of TAVALISSE by our partners depends on their ability to achieve market acceptance of TAVALISSE in its approved indications in their respective territories.
Furthermore, foreign sales of TAVALISSE by our partners could be adversely affected by the imposition of governmental controls, political and economic instability, outbreaks of pandemic diseases, such as the COVID-19 pandemic, trade restrictions or barriers and changes in tariffs, including as a result of the withdrawal of the United Kingdom from the European Union (commonly referred to as “Brexit”) and escalating global trade and political tensions. For example, the ongoing COVID-19 pandemic has resulted in increased travel restrictions and extended shutdowns of certain businesses in the U.S. and around the world. If our collaborators are unable to successfully complete clinical trials, delay commercialization of TAVALISSE or do not invest the resources necessary to successfully commercialize TAVALISSE in international territories where it has been approved, this could reduce the amount of revenue we are due to receive under these license agreements, resulting in harm to our business and operations. If we do not establish and maintain sales and marketing capabilities successfully, either on our own or in collaboration with third parties, we will not be successful in commercializing our product candidates.
Our business could be materially and adversely affected by the ongoing global COVID-19 pandemic as a result of the current and potential future impacts on our sales force and commercialization efforts, supply chain, regulatory, clinical development and corporate development activities and other business operations, in addition to the impact of a global economic slowdown.*
Our business could be adversely affected by the effects of the recent and evolving COVID-19 virus, which was declared by the World Health Organization as a global pandemic. The COVID-19 pandemic has resulted in travel and other restrictions in order to reduce the spread of the disease, including a California executive order, San Francisco Bay Area orders and several other state and local orders across the country, which, among other things, direct individuals to shelter at their places of residence, direct businesses and governmental agencies to cease non-essential operations at physical locations, prohibit certain non-essential gatherings, and order cessation of non-essential travel. The shelter-in-place orders took effect on March 17, 2020 and have been since further extended. In addition, on March 19, 2020, the Governor of California and the State Public Health Officer and Director of the California Department of Public Health issued an executive order that directs all individuals living in the State of California to stay at their place of residence for an indefinite period of time (subject to certain exceptions to facilitate authorized necessary activities) to
mitigate the impact of the COVID-19 pandemic. Other states have followed similar strategies to curtail transmission of the virus.
In response to these public health directives and orders, we have implemented work-from-home policies for certain employees. We have closed our office in South San Francisco and required most of our personnel, including our administrative employees to work remotely, restricted on-site staff to only those personnel who must perform essential activities, suspended new laboratory research or limited the number of staff in any given research and development laboratory. Our increased reliance on personnel working from home may negatively impact productivity, disrupt, delay, or otherwise adversely impact our business. In addition, with most of our employees working remotely, our exposure to cybersecurity risk has increased. This also creates data accessibility concerns and make us more susceptible to communication disruptions. The effects of the executive order, the shelter-in-place order, our work-from-home policies and resulting disruptions may negatively impact productivity, disrupt our business and delay our clinical programs and timelines, the magnitude of which will depend, in part, on the length and severity of the restrictions and other limitations on our ability to conduct our business in the ordinary course. These and similar, and perhaps more severe, disruptions in our operations could negatively impact our business, operating results and financial condition.
Since the COVID-19 pandemic was declared, we have observed reduced patient-doctor interactions and our representatives are having fewer visits with health care providers, which negatively affected our product sales and may continue to negatively affect our product sales in the future. Physicians with practices severely impacted by the COVID-19 pandemic, and who currently prescribe TAVALISSE, may eventually decide to close their independent practices and join a larger medical organization with a practice that does not prescribe TAVALISSE. With most of our employees working remotely, our exposure to cybersecurity risk has increased. This also creates data accessibility concerns and makes us more susceptible to communication disruptions. Additionally, commercial related activities, such as our marketing programs, speaker bureaus, and market access initiatives have been delayed or cancelled as a result of the COVID-19 pandemic. Resources have been deployed to enable our field-based employees to continue to engage remotely with health care providers. Although these virtual engagements have enabled our field team to support existing prescribers, as well as partner with new prescribers to identify appropriate patients for TAVALISSE, we cannot rule out future impact on our business if the pandemic continues for an extended period of time.
With respect to clinical development, we have taken, and continue to take, measures to implement remote and virtual approaches, including remote patient monitoring where possible per recent FDA guidance and working with our investigators for appropriate care of these patients in a safe manner consistent with agency guidelines. We have a number of ongoing clinical trials, one of which is a global Phase 3 clinical study in warm AIHA. A number of our clinical trial investigators have paused, postponed or delayed new patient enrollment and restricted site visits of existing patients enrolled to protect both site staff and patients. We are making decisions country-by-country to minimize risk to the patients and clinical trial sites. We also rely heavily on our clinical trial investigators to inform us of the best course of action with respect to the temporary pause of enrollment/screening where there is uncertainty around the ability of sites to ensure patient safety or data integrity. Patients already enrolled in our studies continue to receive study drug, and we remain focused on supporting our sites in providing care for these patients and providing continued investigational drug supply. At this time, however, we cannot currently fully forecast the scope of impacts that the COVID-19 pandemic may have on our ability to continue to initiate trial sites, continue to treat patients enrolled in our trials, enroll and assess new patients, supply study drug, obtain complete data points in accordance with study protocol and overall impact on clinical study results including the timing thereof. In addition, our partner, Kissei, is currently conducting a Phase 3 clinical trial for fostamatinib in ITP in Japan the timing and completion of which could be delayed due to the coronavirus outbreak. The delays may potentially delay future royalties on sales, as well as, receipt of future potential milestones. At this time, however, we cannot currently fully forecast the scope of impacts that the COVID-19 pandemic may have under our partnership with Kissei.
With respect to our supply chain, we currently do not anticipate significant disruption in the supply chain for our commercial product, TAVALISSE. However, we do not know the full extent of the impact on our supply chain if the COVID-19 pandemic continues and persists for an extended period of time. We currently rely on third parties to, among other things, manufacture and ship our commercial product, raw materials and product supply for our clinical trials, perform quality testing and supply other goods and services to help manage our commercial activities, our clinical trials
and our operations in the ordinary course of business. We have engaged actively with various elements of our supply chain and distribution channel, including our customers, contract manufacturers, and logistics and transportation provider, to meet demand for TAVALISSE and to remain informed of any challenges within our supply chain. We continue to monitor demand, and intend to adapt our plans as needed to continue to drive our business and meet our obligations during the evolving COVID-19 pandemic. However, if the COVID-19 pandemic continues and persists for an extended period of time, we may face continued disruptions to our supply chain and operations, and associated delays in the manufacturing and supply of TAVALISSE. Such supply disruptions would adversely impact our ability to generate sales of and revenues from TAVALISSE and our business, financial condition, results of operations and growth prospects could be adversely affected.
The COVID-19 pandemic has similarly affected our collaboration and licensing partners for the commercialization of fostamatinib globally, as well as in advancing our various clinical stage programs. We do not yet know the full impact of such disruptions in our partners’ ability to advance commercialization of fostamatinib in the market and the timing of enrollment and completion of various clinical trials being conducted by our collaboration partners.
Health regulatory agencies globally may experience disruptions in their operations as a result of the coronavirus pandemic. It is unknown how long these disruptions could continue. Any de-prioritization of our clinical trials or delay in regulatory review resulting from such disruptions could materially affect the completion of our clinical trials.
In addition, the ongoing COVID-19 pandemic continues to rapidly evolve and has already resulted in a significant disruption of global financial markets. If the disruption persists and deepens, we could experience an inability to access additional capital or we may not be able to meet the requirements under our credit facility with MidCap in order for us to draw tranches 3 and/or 4 for $20.0 million each tranche. We could also experience an impact on liquidity, which could in the future negatively affect our capacity for certain corporate development transactions or our ability to make other important, opportunistic investments. In addition, a recession or market correction resulting from the spread of COVID-19 could materially affect our business and the value of our common stock. While we expect the COVID-19 pandemic to adversely affect our business operations and financial results, the extent of the impact on our ability to generate sales of and revenues from our approved products, our ability to continue to secure new collaborations and support existing collaboration efforts with our partners, our clinical development and regulatory efforts, our corporate development objectives and the value of and market for our ordinary shares, will depend on future developments that are highly uncertain and cannot be predicted with confidence at this time, such as the ultimate duration of the pandemic, travel restrictions, quarantines, social distancing and business closure requirements in the U.S. and other countries, and the effectiveness of actions taken globally to contain and treat the disease. For example, if remote work policies for certain portions of our business, or that of our business partners, are extended longer than we currently expect, we may need to reassess our priorities and our corporate objectives for the year. Given the global economic slowdown, the risks and uncertainties associated with the pandemic could adversely affect our business, financial condition, results of operations and growth prospects in the future periods. These effects could adversely affect our business, financial condition, results of operations and growth prospects, as further described in the risks and uncertainties described elsewhere in this ‘‘Risk Factors’’ section.
To the extent the ongoing COVID-19 pandemic adversely affects our business and results of operations, it may also have the effect of heightening many of the other risks and uncertainties described elsewhere in this ‘‘Risk Factors’’ section.
Even if we, or any of our collaborative partners, are able to continue to commercialize TAVALISSE or any product candidate that we, or they, develop, the product may become subject to unfavorable pricing regulations, third-party payor reimbursement practices or labeling restrictions, any of which could harm our business.
The commercial success of any product for which we have obtained regulatory approval, or for which we obtain regulatory approval in the future will depend substantially on the extent to which the costs of our product candidates will be paid by third-party payors, including government health care programs and private health insurers. If coverage is not available, or reimbursement is limited, we, or any of our collaborative partners, may not be able to successfully
commercialize TAVALISSE or any of our product candidates. Even if coverage is provided, the approved reimbursement amount may not be high enough to allow us, or any of our collaborative partners, to establish or maintain pricing sufficient to realize a sufficient return on our or their investments. In the United States, no uniform policy of coverage and reimbursement for products exists among third-party payors and coverage and reimbursement levels for products can differ significantly from payor to payor. As a result, the coverage determination process is often a time consuming and costly process that may require us to provide scientific and clinical support for the use of our products to each payor separately, with no assurance that coverage and adequate reimbursement will be applied consistently or obtained in the first instance.
There is significant uncertainty related to third-party payor coverage and reimbursement of newly approved drugs. Marketing approvals, pricing and reimbursement for new drug products vary widely from country to country. Some countries require approval of the sale price of a drug before it can be marketed. In many countries, the pricing review period begins after marketing or product licensing approval is granted. In some foreign markets, prescription pharmaceutical pricing remains subject to continuing governmental control even after initial approval is granted. As a result, we, or any of our collaborative partners, might obtain marketing approval for a product in a particular country, but then be subject to price regulations that delay commercial launch of the product, possibly for lengthy time periods, which may negatively impact the revenues we are able to generate from the sale of the product in that country. In particular, we cannot predict to what extent the COVID-19 pandemic, depending on its scale and duration, may disrupt global healthcare systems and access to our product or result in a widespread loss of individual health insurance coverage due to unemployment, a shift from commercial payor coverage to government payor coverage, or an increase in demand for patient assistance and/or free drug programs, any of which would adversely affect access to and demand for our product and our net sales. Adverse pricing limitations may also hinder our ability or the ability of any future collaborators to recoup our or their investment in one or more product candidates, even if our product candidates obtain marketing approval.
Patients who are provided medical treatment for their conditions generally rely on third-party payors to reimburse all or part of the costs associated with their treatment. Therefore, our ability, and the ability of any of our collaborative partners, to successfully commercialize fostamatinib or any of our product candidates will depend in part on the extent to which coverage and adequate reimbursement for these products and related treatments will be available from third-party payors.
Additionally, the labeling ultimately approved for any of our product candidates for which we have or may obtain regulatory approval may include restrictions on their uses and may be subject to ongoing FDA or international regulatory authority requirements governing the labeling, packaging, storage, distribution, safety surveillance, advertising, promotion, record-keeping and reporting of safety and other post-market information. If we or any of our collaborative partners do not timely obtain or comply with the labeling approval by the FDA or international regulatory authorities on any of our product candidates, it may delay or inhibit our ability to successfully commercialize our products and generate revenues.
If we are unable to successfully market and distribute TAVALISSE and retain experienced sales force, our business will be substantially harmed.*
We currently have limited experience in marketing and selling pharmaceutical products. TAVALISSE is a newly marketed drug and, therefore, none of the members of our sales force will have ever promoted TAVALISSE prior to its launch. As a result, we will be required to expend significant time and resources and continuously train our sales force to be credible, persuasive and compliant with applicable laws in marketing TAVALISSE for patients with chronic ITP who have had an insufficient response to a previous treatment. In addition, we must continually train our sales force to ensure that an appropriate and compliant message about TAVALISSE is being delivered. If we are unable to effectively train our sales force and equip them with compliant and effective materials, including medical and sales literature to help them appropriately inform and educate regarding its potential benefits and proper administration, our efforts to successfully commercialize TAVALISSE could be put in jeopardy, which would negatively impact our ability to generate product revenues.
We have established our distribution and reimbursement capabilities, all of which will be necessary to successfully commercialize TAVALISSE. As a result, we will be required to expend significant time and resources to market, sell, and distribute TAVALISSE to hematologists and hematologists-oncologists. There is no guarantee that the marketing strategies, or the distribution and reimbursement capabilities, that we have developed will be successful. Particularly, we are dependent on third-party logistics, specialty pharmacies and distribution partners in the distribution of TAVALISSE. If they are unable to perform effectively or if they do not provide efficient distribution of the medicine to patients, our business may be harmed. In addition, we actively participate in medical conferences and exhibits, such as the American Society of Clinical Oncology (ASCO) and ASH Annual Meeting & Exposition that are significant opportunities for us to educate physicians and key opinion leaders about TAVALISSE. Due to the COVID-19 pandemic, ASCO will be held virtually in 2020 and it is uncertain if ASH and other key conferences will be held virtually, postponed or cancelled. Such disruptions may prevent us from effectively educating the prescribing physicians and key opinion leaders about TAVALISSE which would negatively impact our ability to generate sales of and revenues from TAVALISSE and our results of operations and growth prospects could be adversely affected.
Maintaining our sales, marketing, market access and product distribution capabilities requires significant resources, and there are numerous risks involved with managing our commercial team, including our potential inability to successfully train, retain and incentivize adequate numbers of qualified and effective sales and marketing personnel. We are also competing for talent with numerous commercial and pre-commercial-stage oncology-focused biotechnology companies seeking to build out their commercial organizations, as well as other large pharmaceutical organizations that have extensive, well-funded and more experienced sales and marketing operations, and we may be unable to maintain or adequately scale our commercial organization as a result of such competition. If we cannot maintain effective sales, marketing, market access and product distribution capabilities, whether as a result of the ongoing COVID-19 pandemic or otherwise, we may be unable to maximize the commercial potential of TAVALISSE. Also, to the extent that the commercial opportunities for TAVALISSE grow over time, we may not properly judge the requisite size and experience of our current commercialization teams or the level of distribution necessary to market and sell TAVALISSE, which could have an adverse impact on our business, financial condition and results of operations.
Enacted or future legislation, including potentially unfavorable pricing regulations or other healthcare reform initiatives, may increase the difficulty and cost for us to obtain regulatory approval of our product candidates and/or commercialize fostamatinib or our product candidates, once approved, and affect the prices we may set or obtain.
The regulations that govern, among other things, regulatory approvals, coverage, pricing and reimbursement for new drug products vary widely from country to country. In the United States and some foreign jurisdictions, there have been a number of legislative and regulatory changes and proposed changes regarding the healthcare system that could prevent or delay regulatory approval of our product candidates, restrict or regulate post-approval activities and affect our ability to successfully sell fostamatinib or any product candidates for which we obtain regulatory approval in the future. In particular, in March 2010, the Patient Protection and Affordable Care Act, as amended by the Health Care and Education Reconciliation Act, collectively, the Affordable Care Act, was enacted, which substantially changes the way health care is financed by both governmental and private insurers, and significantly impacts the U.S. pharmaceutical industry.
There have been, and likely will continue to be, legislative and regulatory proposals at the foreign, federal and state levels directed at broadening the availability of healthcare and containing or lowering the cost of healthcare. We cannot predict the initiatives that may be adopted in the future. The continuing efforts of the government, insurance companies, managed care organizations and other payors of healthcare services to contain or reduce costs of healthcare and/or impose price controls may adversely affect:
|
·
| |
the demand for fostamatinib or our product candidates, if we obtain regulatory approval; |
|
·
| |
our ability to set a price that we believe is fair for our products; |
|
·
| |
our ability to generate revenue and achieve or maintain profitability; |
|
·
| |
the level of taxes that we are required to pay; and |
|
·
| |
the availability of capital. |
Any reduction in reimbursement from Medicare or other government programs may result in a similar reduction in payments from private payors, which may adversely affect our future profitability.
Legislative and regulatory proposals have been made to expand post-approval requirements and restrict sales and promotional activities for pharmaceutical products. It is also possible that additional governmental action is taken to address the COVID-19 pandemic. We cannot be sure whether additional legislative changes will be enacted, or whether the FDA regulations, guidance or interpretations will be changed, or what the impact of such changes on the regulatory approvals of our product candidates, if any, may be.
In the United States, the European Union and other potentially significant markets for our current and future products, government authorities and third-party payors are increasingly attempting to limit or regulate the price of medical products and services, particularly for new and innovative products and therapies, which has resulted in lower average selling prices. For example, in the United States, there have been several recent Congressional inquiries and federal legislation designed to, among other things, bring more transparency to drug pricing, review the relationship between pricing and manufacturer patient programs, and reform government program reimbursement methodologies for drugs. Furthermore, the increased emphasis on managed healthcare in the United States and on country and regional pricing and reimbursement controls in the E.U. will put additional pressure on product pricing, reimbursement and usage, which may adversely affect our sales and results of operations. These pressures can arise from rules and practices of managed care groups, judicial decisions and governmental laws and regulations related to Medicare, Medicaid and healthcare reform, pharmaceutical reimbursement policies and pricing in general. “See Business – Government Regulation – Healthcare Reform” in our Form 10-K filed on February 27, 2020 for more information on healthcare reform activities.
If the market opportunities for TAVALISSE and product candidates are smaller than we believe they are, our revenues may be adversely affected, and our business may suffer.
Certain of the diseases that TAVALISSE and our other product candidates being developed to address are in underserved and underdiagnosed populations. Our projections of both the number of people who have these diseases, as well as the subset of people with these diseases who will seek treatment utilizing our products or product candidates, may not be accurate. If our estimates of the prevalence or number of patients potentially on therapy prove to be inaccurate, the market opportunities for fostamatinib and our other product candidates may be smaller than what we believe they are, our prospects for generating expected revenue may be adversely affected and our business may suffer.
We may need to continue to increase the size of our organization and we may encounter difficulties with managing our growth, which could adversely affect our business and results of operations.*
Although we have recently substantially increased the size of our organization, we may need to add additional qualified personnel and resources to support our commercial sales force, especially if we experience any potential reduction in our current salesforce due to the ongoing COVID-19 pandemic. Our current infrastructure may be inadequate to support our development and commercialization efforts and expected growth. Future growth will impose significant added responsibilities on members of management, including the need to identify, recruit, maintain and integrate additional employees, and may take time away from running other aspects of our business, including commercialization of TAVALISSE and development of our other product candidates.
Our future financial performance and our ability to sustain successful commercialization of TAVALISSE and our ability to commercialize other product candidates that may receive regulatory approval will depend, in part, on our ability to manage any future growth effectively. In particular, as we continue to commercialize TAVALISSE, we will need to support the training and ongoing activities of our sales force and will likely need to continue to expand the size
of our employee base for managerial, operational, financial and other resources. To that end, we must be able to successfully:
|
·
| |
manage our development efforts effectively; |
|
·
| |
integrate additional management, administrative and manufacturing personnel; |
|
·
| |
further develop our marketing and sales organization; and |
|
·
| |
maintain sufficient administrative, accounting and management information systems and controls. |
We may not be able to accomplish these tasks or successfully manage our operations and, accordingly, may not achieve our research, development, and commercialization goals. Our failure to accomplish any of these goals , including as a result of business or other interruptions resulting from the ongoing COVID-19 pandemic, could adversely affect our business and operations.
Regulatory approval for any approved product is limited by the FDA to those specific indications and conditions for which clinical safety and efficacy have been demonstrated, and we may incur significant liability if it is determined that we are promoting the “off-label” use of TAVALISSE or any of our future product candidates if approved.
Any regulatory approval is limited to those specific diseases, indications and patient populations for which a product is deemed to be safe and effective by the FDA. For example, the FDA-approved label for TAVALISSE is only approved for use in adults with ITP who have had an insufficient response to other treatments. In addition to the FDA approval required for new formulations, any new indication for an approved product also requires FDA approval. If we are not able to obtain FDA approval for any desired future indications for our products and product candidates, our ability to effectively market and sell our products may be reduced and our business may be adversely affected.
While physicians may choose to prescribe drugs for uses that are not described in the product’s labeling and for uses that differ from those tested in clinical studies and approved by the regulatory authorities, our ability to promote the products is limited to those indications and patient populations that are specifically approved by the FDA. These “off-label” uses are common across medical specialties and may constitute an appropriate treatment for some patients in varied circumstances. We have implemented compliance and monitoring policies and procedures, including a process for internal review of promotional materials, to deter the promotion of TAVALISSE for off-label uses. We cannot guarantee that these compliance activities will prevent or timely detect off-label promotion by sales representatives or other personnel in their communications with health care professionals, patients and others, particularly if these activities are concealed from the Company. Regulatory authorities in the United States generally do not regulate the behavior of physicians in their choice of treatments. Regulatory authorities do, however, restrict communications by pharmaceutical companies on the subject of off-label use. If our promotional activities fail to comply with the FDA’s regulations or guidelines, we may be subject to warnings from, or enforcement action by, these regulatory authorities. In addition, our failure to follow FDA rules and guidelines relating to promotion and advertising may cause the FDA to issue warning letters or untitled letters, suspend or withdraw an approved product from the market, require a recall or institute fines, which could result in the disgorgement of money, operating restrictions, injunctions or civil or criminal enforcement, and other consequences, any of which could harm our business.
Notwithstanding the regulatory restrictions on off-label promotion, the FDA and other regulatory authorities allow companies to engage in truthful, non-misleading and non-promotional scientific exchange concerning their products. We engage in medical education activities and communicate with investigators and potential investigators regarding our clinical trials. If the FDA or other regulatory or enforcement authorities determine that our communications regarding our marketed product are not in compliance with the relevant regulatory requirements and that we have improperly promoted off-label uses, or that our communications regarding our investigational products are not in compliance with the relevant regulatory requirements and that we have improperly engaged in pre-approval promotion, we may be subject to significant liability, including civil and administrative remedies as well as criminal sanctions.
We may be subject, directly or indirectly, to federal and state healthcare fraud and abuse laws, false claims laws and other federal and state healthcare laws, and the failure to comply with such laws could result in substantial penalties. Our employees, independent contractors, consultants, principal investigators, CROs, commercial partners and vendors may engage in misconduct or other improper activities, including noncompliance with regulatory standards and requirements.
Our business operations and current and future arrangements with investigators, healthcare professionals, consultants, third-party payers and customers, may expose us to broadly applicable federal, state and foreign fraud and abuse and other healthcare laws and regulations including anti-kickback and false claims laws, data privacy and security laws, and transparency laws. These laws may constrain the business or financial arrangements and relationships through which we conduct our operations, including how we research, market, sell and distribute any product for which we have obtained regulatory approval, or for which we obtain regulatory approval in the future. In particular, the promotion, sales and marketing of healthcare items and services, as well as certain business arrangements in the healthcare industry, are subject to extensive laws and regulations intended to prevent fraud, misconduct, kickbacks, self-dealing and other abusive practices. These laws and regulations may restrict or prohibit a wide range of pricing, discounting, marketing and promotion, including off-label uses of our products, structuring and commission(s), certain customer incentive programs and other business arrangements generally. Activities subject to these laws also involve the improper use or misrepresentation of information obtained in the course of patient recruitment for clinical trials, creating fraudulent data in our preclinical studies or clinical trials or illegal misappropriation of drug product, which could result in regulatory sanctions and cause serious harm to our reputation. See “Business – Governmental Regulation – Healthcare Law and Regulation” for more information on the laws that may affect our ability to operate.
We are also exposed to the risk of fraud, misconduct or other illegal activity by our employees, independent contractors, consultants, principal investigators, CROs, commercial partners and vendors. Misconduct by these parties could include intentional, reckless and/or negligent conduct that fails to: comply with the laws of the FDA and other similar foreign regulatory bodies; provide true, complete and accurate information to the FDA and other similar foreign regulatory bodies; comply with manufacturing standards we have established; comply with federal and state data privacy, security, fraud and abuse and other healthcare laws and regulations in the United States and similar foreign fraudulent misconduct laws; or report financial information or data accurately or to disclose unauthorized activities to us. It is not always possible to identify and deter employee misconduct, and the precautions we take to detect and prevent inappropriate conduct may not be effective in controlling unknown or unmanaged risks or losses or in protecting us from governmental investigations or other actions or lawsuits stemming from a failure to be in compliance with such laws or regulations.
We are also subject to the risk that a person or government could allege such fraud or other misconduct, even if none occurred. Efforts to ensure that our business arrangements will comply with applicable healthcare laws and regulations will involve substantial costs. It is possible that governmental and enforcement authorities will conclude that our business practices may not comply with current or future statutes, regulations or case law interpreting applicable fraud and abuse or other healthcare laws and regulations. If any such actions are instituted against us, and we are not successful in defending ourselves or asserting our rights, those actions could have a significant impact on our business, including the imposition of significant civil, criminal and administrative penalties, damages, disgorgement, monetary fines, individual imprisonment, additional reporting obligations and oversight if we become subject to a corporate integrity agreement or other agreement to resolve allegations of non-compliance with these laws, possible exclusion from participation in Medicare, Medicaid and other federal healthcare programs, contractual damages, reputational harm, diminished profits and future earnings, and curtailment or restructuring of our operations, any of which could adversely affect our ability to operate our business and our results of operations.
Enhanced governmental and public scrutiny over, or investigations or litigation involving, pharmaceutical manufacturer donations to patient assistance programs may require us to modify our programs and could negatively impact our business practices, harm our reputation, divert the attention of management and increase our expenses.
To help patients afford our products, we have a patient assistance program that help financially needy patients. This type of program has become the subject of scrutiny. Some pharmaceutical manufacturers were named in class action lawsuits challenging the legality of their patient assistance programs under a variety of federal and state laws. Our patient assistance program could become the target of similar litigation. In addition, certain state and federal enforcement authorities and members of Congress have initiated inquiries about co-pay assistance programs. Some state legislatures have also been considering proposals that would restrict or ban co-pay coupons.
If we are deemed not to have complied with laws or regulations in the operation of these programs, we could be subject to damages, fines, penalties or other criminal, civil or administrative sanctions or enforcement actions. Further, numerous organizations, including pharmaceutical manufacturers, have been subject to ongoing litigation, enforcement activities and settlements related to their patient assistance programs and support, and certain of these organizations have entered into, or have otherwise agreed to, significant civil settlements with applicable enforcement authorities. It is possible that future legislation may propose establishing requirements that affect pharmaceutical manufacturers. We cannot ensure that our compliance controls, policies and procedures will be sufficient to protect against acts of our employees, business partners or vendors that may violate the laws or regulations of the jurisdictions in which we operate. A government investigation could negatively impact our business practices, harm our reputation, divert the attention of management and increase our expenses.
If manufacturers obtain approval for generic versions of TAVALISSE, or of products with which we compete, our business may be harmed.
Under the U.S. Food, Drug and Cosmetic Act (FDCA), the FDA can approve an ANDA for a generic version of a branded drug without the ANDA applicant undertaking the clinical testing necessary to obtain approval to market a new drug. Generally, in place of such clinical studies, an ANDA applicant usually needs only to submit data demonstrating that its product has the same active ingredient(s), strength, dosage form, route of administration and that it is bioequivalent to the branded product. In September 2019, the FDA published product-specific bioequivalence guidance on fostamatinib disodium to let potential ANDA applicants understand the data FDA would expect to see for approval of a generic version of TAVALISSE.
The FDCA requires that an applicant for approval of a generic form of a branded drug certify either that its generic product does not infringe any of the patents listed by the owner of the branded drug in the Orange Book or that those patents are not enforceable. This process is known as a paragraph IV challenge. Upon notice of a paragraph IV challenge, a patent owner has 45 days to bring a patent infringement suit in federal district court against the company seeking ANDA approval of a product covered by one of the owner’s patents. If this type of suit is commenced, the FDCA provides a 30-month stay on the FDA’s approval of the competitor’s application. If the litigation is resolved in favor of the ANDA applicant or the challenged patent expires during the 30-month stay period, the stay is lifted, and the FDA may thereafter approve the application based on the standards for approval of ANDAs. Once an ANDA is approved by the FDA, the generic manufacturer may market and sell the generic form of the branded drug in competition with the branded medicine.
The ANDA process can result in generic competition if the patents at issue are not upheld or if the generic competitor is found not to infringe the owner’s patents. If this were to occur with respect to TAVALISSE or products with which it competes, our business would be harmed. We have a number of patents listed in the Orange Book, the last of which is expected to expire in July 2032.
Unforeseen safety issues could emerge with TAVALISSE that could require us to change the prescribing information to add warnings, limit use of the product, and/or result in litigation. Any of these events could have a negative impact on our business.
Discovery of unforeseen safety problems or increased focus on a known problem could impact our ability to commercialize TAVALISSE and could result in restrictions on its permissible uses, including withdrawal of the medicine from the market.
If we or others identify additional undesirable side effects caused by TAVALISSE after approval:
|
·
| |
regulatory authorities may require the addition of labeling statements, specific warnings, contraindications, or field alerts to physicians and pharmacies; |
|
·
| |
regulatory authorities may withdraw their approval of the product and require us to take our approved drugs off the market; |
|
·
| |
we may be required to change the way the product is administered, conduct additional clinical trials, change the labeling of the product, or implement a Risk Evaluation and Mitigation Strategy, or REMS; |
|
·
| |
we may have limitations on how we promote our drugs; |
|
·
| |
third-party payers may limit coverage or reimbursement for TAVALISSE; |
|
·
| |
sales of TAVALISSE may decrease significantly; |
|
·
| |
we may be subject to litigation or product liability claims; and |
|
·
| |
our reputation may suffer. |
Any of these events could prevent us from achieving or maintaining market acceptance of TAVALISSE and could substantially increase our operating costs and expenses, which in turn could delay or prevent us from generating significant revenue from sale of TAVALISSE.
If a safety issue emerges post-approval, we may become subject to costly product liability litigation by our customers, their patients or payers. Product liability claims could divert management’s attention from our core business, be expensive to defend, and result in sizable damage awards against us that may not be covered by insurance. If we cannot successfully defend ourselves against claims that TAVALISSE caused injuries, we will incur substantial liabilities. Regardless of merit or eventual outcome, liability claims may result in:
|
·
| |
decreased demand for any product candidates or products that we may develop; |
|
·
| |
the inability to commercialize any products that we may develop; |
|
·
| |
injury to our reputation and significant negative media attention; |
|
·
| |
withdrawal of patients from clinical studies or cancellation of studies; |
|
·
| |
significant costs to defend the related litigation; |
|
·
| |
substantial monetary awards to patients; and |
We currently hold $10.0 million in product liability insurance coverage, which may not be adequate to cover all liabilities that we may incur. Insurance coverage is increasingly expensive. We may not be able to obtain insurance
coverage at a reasonable cost or in amounts adequate to satisfy any liability or associated costs that may arise in the future. These events could harm our business and results of operations and cause our stock price to decline.
If we fail to comply with our reporting and payment obligations under the Medicaid Drug Rebate Program or other governmental pricing programs in the United States, we could be subject to additional reimbursement requirements, fines, sanctions and exposure under other laws which could have an adverse effect on our business, results of operations and financial condition.
We participate in the Medicaid Drug Rebate Program, as administered by the CMS, and other federal and state government pricing programs in the United States, and we may participate in additional government pricing programs in the future. These programs generally require us to pay rebates or otherwise provide discounts to government payers in connection with drugs that are dispensed to beneficiaries/recipients of these programs. In some cases, such as with the Medicaid Drug Rebate Program, the rebates are based on pricing that we report on a monthly and quarterly basis to the government agencies that administer the programs. Pricing requirements and rebate/discount calculations are complex, vary among products and programs, and are often subject to interpretation by governmental or regulatory agencies and the courts. The requirements of these programs, including, by way of example, their respective terms and scope, change frequently. Responding to current and future changes may increase our costs, and the complexity of compliance will be time consuming. Invoicing for rebates is provided in arrears, and there is frequently a time lag of up to several months between the sales to which rebate notices relate and our receipt of those notices, which further complicates our ability to accurately estimate and accrue for rebates related to the Medicaid program as implemented by individual states. Thus, there can be no assurance that we will be able to identify all factors that may cause our discount and rebate payment obligations to vary from period to period, and our actual results may differ significantly from our estimated allowances for discounts and rebates. Changes in estimates and assumptions may have an adverse effect on our business, results of operations and financial condition.
In addition, the Office of Inspector General of the Department of Health and Human Services and other Congressional enforcement and administrative bodies have recently increased their focus on pricing requirements for products, including, but not limited to the methodologies used by manufacturers to calculate average manufacturer price, or AMP, and best price, or BP, for compliance with reporting requirements under the Medicaid Drug Rebate Program. We are liable for errors associated with our submission of pricing data and for any overcharging of government payers. Failure to make necessary disclosures and/or to identify overpayments could result in allegations against us under the Federal False Claims Act and other laws and regulations. Any required refunds to the U.S. government or responding to a government investigation or enforcement action would be expensive and time consuming and could have an adverse effect on our business, results of operations and financial condition. In addition, in the event that CMS were to terminate our rebate agreement, no federal payments would be available under Medicaid or Medicare for our covered outpatient drugs.
Even for those product candidates that have or may receive regulatory approval, they may fail to achieve the degree of market acceptance by physicians, patients, healthcare payors and others in the medical community necessary for commercial success, in which case we may not generate significant revenues or become profitable.
For our product candidates that have or may receive regulatory approval, they may nonetheless fail to gain sufficient market acceptance by physicians, hospital administrators, patients, healthcare payors and others in the medical community. The degree of market acceptance of our product candidates, if approved for commercial sale, will depend on a number of factors, including the following:
|
·
| |
relative convenience and ease of administration; |
|
·
| |
the willingness of the target patient population to try new therapies and of physicians to prescribe these therapies; |
|
·
| |
the willingness of physicians to change their current treatment practices; |
|
·
| |
the willingness of hospitals and hospital systems to include our product candidates as treatment options; |
|
·
| |
demonstration of efficacy and safety in clinical trials; |
|
·
| |
the prevalence and severity of any side effects; |
|
·
| |
the ability to offer product candidates for sale at competitive prices; |
|
·
| |
the price we charge for our product candidates; |
|
·
| |
the strength of marketing and distribution support; and |
|
·
| |
the availability of third-party coverage and adequate reimbursement and the willingness of patients to pay out-of-pocket in the absence of such coverage and adequate reimbursement. |
Efforts to educate the physicians, patients, healthcare payors and others in the medical community on the benefits of our product candidates may require significant resources and may not be successful. If any of our product candidates are approved, if at all, but do not achieve an adequate level of acceptance, we may not generate significant product revenue and we may not become profitable on a sustained basis.
We will need additional capital in the future to sufficiently fund our operations and research.*
We have consumed substantial amounts of capital to date as we continue our research and development activities, including preclinical studies and clinical trials and for the commercial launch of TAVALISSE. We may seek another collaborator or licensee in the future for further clinical development and commercialization of fostamatinib, as well as our other clinical programs, which we may not be able to obtain on commercially reasonable terms or at all. We believe that our existing capital resources will be sufficient to support our current and projected funding requirements, including the continued commercial launch of TAVALISSE in the U.S., through at least the next 12 months. We have based this estimate on assumptions that may prove to be wrong, and we could utilize our available capital resources sooner than we currently expect. Because of the numerous risks and uncertainties associated with commercial launch, the development of our product candidates and other research and development activities, we are unable to estimate with certainty our future product revenues, our revenues from our current and future collaborative partners, the amounts of increased capital outlays and operating expenditures associated with our current and anticipated clinical trials and other research and development activities.
We will continue to need additional capital and the amount of future capital needed will depend largely on the success of our commercial launch of TAVALISSE and the success of our internally developed programs as they proceed in later and more expensive clinical trials, including any additional clinical trials that we may decide to conduct with respect to fostamatinib. We do not know whether additional financing will be available when needed, or that, if available, we will obtain financing on reasonable terms. Our ability to raise additional capital, including our ability to secure new collaborations and continue to support existing collaboration efforts with our partners, may also be adversely impacted by potential worsening global economic conditions and the recent disruptions to, and volatility in, the credit and financial markets in the U.S. and worldwide resulting from the ongoing COVID-19 pandemic. Unless and until we are able to generate a sufficient amount of product, royalty or milestone revenue, which may never occur, we expect to finance future cash needs through public and/or private offerings of equity securities, debt financings or collaboration and licensing arrangements, as well as through proceeds from exercise of stock options and interest income earned on the investment of our cash balances and short-term investments. To the extent we raise additional capital by issuing equity securities in the future, our stockholders could at that time experience substantial dilution. In addition, we have a significant number of stock options outstanding. To the extent that outstanding stock options have been or may be exercised or other shares issued, our stockholders may experience further dilution. Further, we may choose to raise additional capital due to market conditions or strategic considerations even if we believe we have sufficient funds for our
current or future operating plans, including through an “at-the-market” equity offering program. Our credit facility with MidCap involve certain covenants and any other debt financing that we are able to obtain in the future may involve operating covenants that restrict our business. To the extent that we raise additional funds through any new collaboration and licensing arrangements, we may be required to refund certain payments made to us, relinquish some rights to our technologies or product candidates or grant licenses on terms that are not favorable to us.
We have indebtedness in the form of term loan pursuant to the Credit Agreement with MidCap, which could adversely affect our financial condition and our ability to respond to changes in our business. Further, if we are unable to satisfy certain conditions of the Credit Agreement, we will be unable to draw down the remainder of the facility. If we are unable to satisfy certain conditions of the Credit Agreement, we will unable to draw down the remainder of the facility.
In September 2019, we entered into the Credit Agreement with MidCap. Under the Credit Agreement, we are required to repay amounts due when there is an event of default for the term loans that results in the principal, premium, if any, and interest, if any, becoming due prior to the maturity date for the term loans. The Credit Agreement also contains a number of other affirmative and restrictive covenants. Please see Note 13 to the Financial Statements herein for additional details of the Credit Agreement. These and other terms in the Credit Agreement have to be monitored closely for compliance and could restrict our ability to grow our business or enter into transactions that we believe would be beneficial to our business. Our business may not generate cash flow from operations in the future sufficient to service our debt and support our growth strategies. If we are unable to generate such cash flow, we may be required to adopt one or more alternatives, such as restructuring our debt or obtaining additional equity capital on terms that may be onerous or highly dilutive. Our ability to refinance our indebtedness will depend on the capital markets and our financial condition at such time. We may not be able to engage in any of these activities or engage in these activities on desirable terms, which could result in a default on our current debt obligations. In addition, we cannot be sure that additional financing will be available when required or, if available, will be on terms satisfactory to us. Further, even if we are able to obtain additional financing, we may be required to use such proceeds to repay a portion of our debt.
Our indebtedness may have other adverse effects, such as:
|
·
| |
our vulnerability to adverse general economic conditions and heightened competitive pressures; |
|
·
| |
dedication of a portion of our cash flow from operations to interest payments, limiting the availability of cash for other operational purposes; |
|
·
| |
limited flexibility in planning for, or reacting to, changes in our business and industry; and |
|
·
| |
our inability to obtain additional financing in the future. |
Our Credit Agreement with MidCap contains a mandatory prepayment provision that gives the Agent the right to demand payment of the outstanding principal and additional interest and fees in the event of default. We may not have enough available cash or be able to obtain financing at the time we are required to repay the term loan with additional interest and fees prior to maturity.
At closing, $10.0 million was funded to us in an initial tranche. The Credit Agreement also gives us the ability to access an additional $50.0 million at our option, of which $40.0 million may be drawn in 2 tranches subject to the achievement of certain customary conditions. In May 2020, our second tranche of $10.0 million was funded by MidCap. If we are unable to satisfy these or other required conditions, we would not be able to draw down the remaining tranches of financing and may not be able to obtain alternative financing on commercially reasonable terms or at all, which could adversely impact our business.
We rely and may continue to rely on a single distribution facility for the sale of TAVALISSE and potential sale of any of our product candidates.
Our distribution operations for the sale of TAVALISSE is currently concentrated in one distribution center owned by a third-party logistics provider. Additionally our distribution operations, if and when we launch any of our product candidates in the future, may also be concentrated in a single distribution center owned by a third-party logistics
provider. Any errors in inventory level management and unforeseen inventory shortage could adversely affect our business. In addition, any significant disruption in the operation of the facility due to natural disaster or severe weather, or events such as fire, accidents, power outages, system failures, or other unforeseen causes, could devalue or damage a significant portion of our inventories and could adversely affect our product distribution and sales until such time as we could secure an alternative facility. If we encounter difficulties with our distribution facility, whether due to the impacts of the ongoing COVID-19 pandemic (including as a result of disruptions of global shipping and the transport of products) or otherwise, or other problems or disasters arise, we cannot ensure that critical systems and operations will be restored in a timely manner or at all, and this would have an adverse effect on our business. In addition, growth could require us to further expand our current facility, which could affect us adversely in ways that we cannot predict.
We lack the capability to manufacture compounds for clinical development and we intend to rely on third parties for commercial supply, manufacturing and distribution if any of our product candidates which receive regulatory approval and we may be unable to obtain required material or product in a timely manner, at an acceptable cost or at a quality level required to receive regulatory approval.
We currently do not have the manufacturing capabilities or experience necessary to produce TAVALISSE or any product candidates for clinical trials, including fostamatinib in AIHA, our IRAK inhibitor program and our RIP1 inhibitor program. We currently use one manufacturer of fostamatinib. We do not currently have, nor do we plan to acquire the infrastructure or capability to supply, manufacture or distribute preclinical, clinical or commercial quantities of drug substances or products. For each clinical trial of our unpartnered product candidates, we rely on third-party manufacturers for the active pharmaceutical ingredients, as well as various manufacturers to manufacture starting components, excipients and formulated drug products. Our ability to develop our product candidates, and our ability to commercially supply our products will depend, in part, on our ability to successfully obtain the APIs and other substances and materials used in our product candidates from third parties and to have finished products manufactured by third parties in accordance with regulatory requirements and in sufficient quantities for preclinical and clinical testing and commercialization. If we fail to develop and maintain supply relationships with these third parties, we may be unable to continue to develop or commercialize our product candidates.
We rely and will continue to rely on certain third parties, including those located outside the U.S., as our limited source of the materials they supply or the finished products they manufacture. The drug substances and other materials used in our product candidates are currently available only from one or a limited number of suppliers or manufacturers and certain of our finished product candidates are manufactured by one or a limited number of contract manufacturers. Any of these existing suppliers or manufacturers may:
|
·
| |
fail to supply us with product on a timely basis or in the requested amount due to unexpected damage to or destruction of facilities or equipment or otherwise; |
|
·
| |
fail to increase manufacturing capacity and produce drug product and components in larger quantities and at higher yields in a timely or cost-effective manner, or at all, to sufficiently meet our commercial needs; |
|
·
| |
be unable to meet our production demands due to issues related to their reliance on sole-source suppliers and manufacturers; |
|
·
| |
supply us with product that fails to meet regulatory requirements; |
|
·
| |
become unavailable through business interruption or financial insolvency; |
|
·
| |
lose regulatory status as an approved source; |
|
·
| |
be unable or unwilling to renew current supply agreements when such agreements expire on a timely basis, on acceptable terms or at all; or |
|
·
| |
discontinue production or manufacturing of necessary drug substances or products. |
Our current and anticipated future dependence upon these third-party manufacturers may adversely affect our ability to develop and commercialize product candidates on a timely and competitive basis, which could have an adverse effect on sales, results of operations and financial condition. If we were required to transfer manufacturing processes to other third-party manufacturers and we were able to identify an alternative manufacturer, we would still need to satisfy various regulatory requirements. Satisfaction of these requirements could cause us to experience significant delays in receiving an adequate supply of our products and products in development and could be costly. Moreover, we may not be able to transfer processes that are proprietary to the manufacturer, if any. These manufacturers may not be able to produce material on a timely basis or manufacture material at the quality level or in the quantity required to meet our development timelines and applicable regulatory requirements and may also experience a shortage in qualified personnel, including due to the impacts of the COVID-19 pandemic. We may not be able to maintain or renew our existing third-party manufacturing arrangements, or enter into new arrangements, on acceptable terms, or at all. Our third-party manufacturers could terminate or decline to renew our manufacturing arrangements based on their own business priorities, at a time that is costly or inconvenient for us. If we are unable to contract for the production of materials in sufficient quantity and of sufficient quality on acceptable terms, our planned clinical trials may be significantly delayed. Manufacturing delays could postpone the filing of our IND applications and/or the initiation or completion of clinical trials that we have currently planned or may plan in the future.
Drug manufacturers are subject to ongoing periodic unannounced inspection by the FDA, the Drug Enforcement Administration, and other federal and state agencies to ensure strict compliance with cGMP and other government regulations and corresponding foreign standards. We do not have control over third-party manufacturers’ compliance with these regulations and standards and they may not be able to comply. Switching manufacturers may be difficult because the number of potential manufacturers is limited. It may be difficult or impossible for us to find a replacement manufacturer quickly on acceptable terms, or at all. Additionally, if we are required to enter into new supply arrangements, we may not be able to obtain approval from the FDA of any alternate supplier in a timely manner, or at all, which could delay or prevent the clinical development and commercialization of any related product candidates. Failure of our third-party manufacturers or us to comply with applicable regulations, whether due to the impacts of the ongoing COVID-19 pandemic or otherwise, could result in sanctions being imposed on us, including fines, civil penalties, delays in or failure to grant marketing approval of our product candidates, injunctions, delays, suspension or withdrawal of approvals, license revocation, seizures or recalls of products and compounds, operating restrictions and criminal prosecutions, any of which could adversely affect our business.
Forecasting potential sales for any of our product candidates will be difficult, and if our projections are inaccurate, our business may be harmed, and our stock price may be adversely affected.
Our business planning requires us to forecast or make assumptions regarding product demand and revenues for any of our product candidates if they are approved despite numerous uncertainties. These uncertainties may be increased if we rely on our collaborators or other third parties to conduct commercial activities in certain geographies and provide us with accurate and timely information. Actual results may differ materially from projected results for various reasons, including the following, as well as risks identified in other risk factors:
|
·
| |
the efficacy and safety of any of our product candidates, including as relative to marketed products and product candidates in development by third parties; |
|
·
| |
pricing (including discounting or other promotions), reimbursement, product returns or recalls, competition, labeling, adverse events and other items that impact commercialization; |
|
·
| |
the rate of adoption in the particular market, including fluctuations in demand for various reasons; |
|
·
| |
impacts due to the ongoing COVID-19 pandemic; |
|
·
| |
lack of patient and physician familiarity with the drug; |
|
·
| |
lack of patient use and physician prescribing history; |
|
·
| |
lack of commercialization experience with the drug; |
|
·
| |
actual sales to patients may significantly differ from expectations based on sales to wholesalers; and |
uncertainty relating to when the drug may become commercially available to patients and rate of adoption in other territories.
We expect that our revenues from sales of any of our product candidates will continue to be based in part on estimates, judgment and accounting policies. Any incorrect estimates or disagreements with regulators or others regarding such estimates or accounting policies may result in changes to our guidance, projections or previously reported results. Expected and actual product sales and quarterly and other results may greatly fluctuate, including in the near-term, and such fluctuations can adversely affect the price of our common stock, perceptions of our ability to forecast demand and revenues, and our ability to maintain and fund our operations.
We might not be able to successfully develop or commercialize our product candidates if problems arise in the clinical testing and approval process.*
The activities associated with the research, development and commercialization of fostamatinib and other product candidates in our pipeline must undergo extensive clinical trials, which can take many years and require substantial expenditures, subject to extensive regulation by the FDA and other regulatory agencies in the U.S. and by comparable authorities in other countries. The process of obtaining regulatory approvals in the U.S. and other foreign jurisdictions is expensive, and lengthy, if approval is obtained at all.
Our clinical trials may fail to produce results satisfactory to the FDA or regulatory authorities in other jurisdictions. The regulatory process also requires preclinical testing, and data obtained from preclinical and clinical activities are susceptible to varying interpretations. The FDA has substantial discretion in the approval process and may refuse to approve any NDA or sNDA and decide that our data is insufficient for approval and require additional preclinical, clinical or other studies. Varying interpretations of the data obtained from preclinical and clinical testing could delay, limit or prevent regulatory approval of fostamatinib for any individual, additional indications.
Due to the ongoing COVID-19 pandemic, it is also possible that we could experience delays in the timing of our interactions with regulatory authorities due to absenteeism by governmental employees or the diversion of regulatory authority efforts and attention to approval of other therapeutics or other activities related to COVID-19, which could delay or limit our ability to make planned regulatory submissions or develop and commercialize our product candidates on anticipated timelines.
In addition, delays or rejections may be encountered based upon changes in regulatory policy for product approval during the period of product development and regulatory agency review, which may cause delays in the approval or rejection of an application for fostamatinib or for our other product candidates.
Commercialization of our product candidates depends upon successful completion of extensive preclinical studies and clinical trials to demonstrate their safety and efficacy for humans. Preclinical testing and clinical development are long, expensive and uncertain processes.
In connection with clinical trials of our product candidates, we may face the following risks among others:
|
·
| |
the product candidate may not prove to be effective; |
|
·
| |
the product candidate may cause harmful side effects; |
|
·
| |
the clinical results may not replicate the results of earlier, smaller trials; |
|
·
| |
we or third parties with whom we collaborate, may be significantly impacted by the evolving impacts of the ongoing COVID-19 pandemic; |
|
·
| |
we, or the FDA or similar foreign regulatory authorities, may delay, terminate or suspend the trials; |
|
·
| |
our results may not be statistically significant; |
|
·
| |
patient recruitment and enrollment may be slower than expected; |
|
·
| |
patients may drop out of the trials or otherwise not enroll; and |
|
·
| |
regulatory and clinical trial requirements, interpretations or guidance may change. |
We do not know whether we will be permitted to undertake clinical trials of potential products beyond the trials already concluded and the trials currently in process. It will take us, or our collaborative partners several years to complete any such testing, and failure can occur at any stage of testing. Interim results of trials do not necessarily predict final results, and acceptable results in early trials may not be repeated in later trials. A number of companies in the pharmaceutical industry, including biotechnology companies, have suffered significant setbacks in advanced clinical trials, even after achieving promising results in earlier trials.
Any product for which we have obtained regulatory approval, or for which we obtain approval in the future, is subject to, or will be subject to, extensive ongoing regulatory requirements by the FDA, EMA and other comparable regulatory authorities, and if we fail to comply with regulatory requirements or if we experience unanticipated problems with our products, we may be subject to penalties, we will be unable to generate revenue from the sale of such products, our potential for generating positive cash flow will be diminished, and the capital necessary to fund our operations will be increased.*
In April 2018, the FDA had approved TAVALISSE for the treatment of adult patients with chronic ITP who have had insufficient response to previous treatment. We launched fostamatinib in the United States on our own in late May 2018. In January 2019, we entered into an exclusive commercialization license agreement with Grifols to commercialize fostamatinib for the treatment, palliation, or prevention of human diseases, including chronic or persistent immune ITP, AIHA, and IgAN in Europe and Turkey and in October 2018, we entered into an exclusive license and supply agreement with Kissei for the development and commercialization of fostamatinib in all indications in Japan, China, Taiwan, and the Republic of Korea. In October 2019, we also entered into two exclusive license agreements with Medison to commercialize fostamatinib in all potential indications in Canada and Israel. Any product for which we have obtained regulatory approval, or for which we obtain regulatory approval in the future, along with the manufacturing processes and practices, post-approval clinical research, product labeling, advertising and promotional activities for such product, are subject to continual requirements of, and review by, the FDA, the EMA and other comparable international regulatory authorities. These requirements include submissions of safety and other post-marketing information and reports, registration and listing requirements, current good manufacturing practices (cGMP) requirements relating to manufacturing, quality control, quality assurance and corresponding maintenance of records and documents, requirements regarding the distribution of samples to physicians, import and export requirements and recordkeeping. If we or our suppliers encounter manufacturing, quality or compliance difficulties with respect to TAVALISSE or any of our product candidates, when and if approved, whether due to the impacts of the ongoing COVID-19 pandemic (including as a result of disruptions of global shipping and the transport of products) or otherwise, we may be unable to obtain or maintain regulatory approval or meet commercial demand for such products, which could adversely affect our business, financial conditions, results of operations and growth prospects.
Promotional communications with respect to prescription drugs are subject to a variety of legal and regulatory restrictions and must be consistent with the information in the product's approved labeling. Thus, we will not be able to promote any products we develop for indications or uses for which they are not approved.
In addition, the FDA often requires post-marketing testing and surveillance to monitor the effects of products. The FDA, the EMA and other comparable international regulatory agencies may condition approval of our product candidates on the completion of such post-marketing clinical studies. These post-marketing studies may suggest that a product causes undesirable side effects or may present a risk to the patient. Additionally, the FDA may require Risk Evaluation and Mitigation Strategies (REMS) to help ensure that the benefits of the drug outweigh its risks. A REMS may be required to include various elements, such as a medication guide or patient package insert, a communication plan to educate healthcare providers of the drug’s risks, limitations on who may prescribe or dispense the drug, requirements that patients enroll in a registry or undergo certain health evaluations or other measures that the FDA deems necessary to ensure the safe use of the drug.
Discovery after approval of previously unknown problems with any of our products, manufacturers or manufacturing processes, or failure to comply with regulatory requirements, may result in actions such as:
|
·
| |
restrictions on our ability to conduct clinical trials, including full or partial clinical holds on ongoing or planned trials; |
|
·
| |
restrictions on product manufacturing processes; |
|
·
| |
restrictions on the marketing of a product; |
|
·
| |
restrictions on product distribution; |
|
·
| |
requirements to conduct post-marketing clinical trials; |
|
·
| |
untitled or warning letters or other adverse publicity; |
|
·
| |
withdrawal of products from the market; |
|
·
| |
refusal to approve pending applications or supplements to approved applications that we submit; |
|
·
| |
refusal to permit the import or export of our products; |
|
·
| |
fines, restitution or disgorgement of profits or revenue; |
|
·
| |
refusal to allow us to enter into supply contracts, including government contracts; |
|
·
| |
imposition of civil or criminal penalties. |
If such regulatory actions are taken, the value of our company and our operating results will be adversely affected. Additionally, if the FDA, the EMA or any other comparable international regulatory agency withdraws its approval of a product that is or may be approved, we will be unable to generate revenue from the sale of that product in the relevant jurisdiction, our potential for generating positive cash flow will be diminished and the capital necessary to fund our operations will be increased. Accordingly, we continue to expend significant time, money and effort in all areas of regulatory compliance, including manufacturing, production, product surveillance, post-marketing studies and quality control.
We do not and will not have access to all information regarding fostamatinib and product candidates we licensed to Kissei, Grifols and Medison.
We do not and will not have access to all information regarding fostamatinib and other product candidates, including potentially material information about commercialization plans, medical information strategies, clinical trial design and execution, safety reports from clinical trials, safety reports, regulatory affairs, process development, manufacturing and other areas known by Kissei, Grifols and Medison. In addition, we have confidentiality obligations under our agreement with Kissei, Grifols and Medison. Thus, our ability to keep our shareholders informed about the status of fostamatinib will be limited by the degree to which Kissei, Grifols and/or Medison keep us informed and allows us to disclose such information to the public. If Kissei, Grifols and/or Medison fail to keep us informed about commercialization efforts related to fostamatinib, or the status of the clinical development or regulatory approval pathway of other product candidates licensed to them, we may make operational and/or investment decisions that we would not have made had we been fully informed, which may adversely affect our business and operations.
If we are unable to obtain regulatory approval to market products in the United States and foreign jurisdictions, we will not be permitted to commercialize products we or our collaborative partners may develop.
We cannot predict whether regulatory clearance will be obtained for any product that we, or our collaborative partners, hope to develop. Satisfaction of regulatory requirements typically takes many years, is dependent upon the type, complexity and novelty of the product and requires the expenditure of substantial resources. Of particular significance to us are the requirements relating to research and development and testing.
Before commencing clinical trials in humans in the United States, we, or our collaborative partners, will need to submit and receive approval from the FDA of an IND application. Clinical trials are subject to oversight by institutional review boards and the FDA and:
|
·
| |
must be conducted in conformance with the FDA’s good clinical practices and other applicable regulations; |
|
·
| |
must meet requirements for institutional review board oversight; |
|
·
| |
must meet requirements for informed consent; |
|
·
| |
are subject to continuing FDA and regulatory oversight; |
|
·
| |
may require large numbers of test subjects; and |
|
·
| |
may be suspended by us, our collaborators or the FDA at any time if it is believed that the subjects participating in these trials are being exposed to unacceptable health risks or if the FDA finds deficiencies in the IND or the conduct of these trials. |
While we have stated that we intend to file additional INDs for future product candidates, this is only a statement of intent, and we may not be able to do so because we may not be able to identify potential product candidates. In addition, the FDA may not approve any IND we or our collaborative partners may submit in a timely manner, or at all.
Before receiving FDA approval to market a product, we must demonstrate with substantial clinical evidence that the product is safe and effective in the patient population and the indication that will be treated. Data obtained from preclinical and clinical activities are susceptible to varying interpretations that could delay, limit or prevent regulatory approvals. In addition, delays or rejections may be encountered based upon additional government regulation from future legislation or administrative action or changes in FDA policy during the period of product development, clinical trials and FDA regulatory review. Failure to comply with applicable FDA or other applicable regulatory requirements may result in criminal prosecution, civil penalties, recall or seizure of products, total or partial suspension of production or injunction, adverse publicity, as well as other regulatory action against our potential products or us. Additionally, we have limited experience in conducting and managing the clinical trials necessary to obtain regulatory approval.
If regulatory approval of a product is granted, this approval will be limited to those indications or disease states and conditions for which the product is demonstrated through clinical trials to be safe and efficacious. We cannot assure you that any compound developed by us, alone or with others, will prove to be safe and efficacious in clinical trials and will meet all of the applicable regulatory requirements needed to receive marketing approval.
Outside the United States, our ability, or that of our collaborative partners, to market a product is contingent upon receiving a marketing authorization from the appropriate regulatory authorities. This foreign regulatory approval process typically includes all of the risks and costs associated with FDA approval described above and may also include additional risks and costs, such as the risk that such foreign regulatory authorities, which often have different regulatory and clinical trial requirements, interpretations and guidance from the FDA, may require additional clinical trials or results for approval of a product candidate, any of which could result in delays, significant additional costs or failure to obtain such regulatory approval. There can be no assurance, however, that we or our collaborative partners will not have to provide additional information or analysis, or conduct additional clinical trials, before receiving approval to market product candidates.
We may be unable to expand our product pipeline, which could limit our growth and revenue potential.
Our business is focused on the discovery, development and commercialization of novel small molecule drugs that significantly improve the lives of patients with immune and hematologic disorders, cancer and rare diseases. In this regard, we are pursuing internal drug discovery efforts with the goal of identifying new product candidates to advance into clinical trials. Internal discovery efforts to identify new product candidates require substantial technical, financial and human resources. These internal discovery efforts may initially show promise in identifying potential product candidates, yet ultimately fail to yield product candidates for clinical development for a number of reasons. For example, potential product candidates may, on later stage clinical study, be shown to have inadequate efficacy, harmful side effects, suboptimal pharmaceutical profiles or other characteristics suggesting that they are unlikely to be commercially viable products.
Apart from our internal discovery efforts, our strategy to expand our development pipeline is also dependent on our ability to successfully identify and acquire or in-license relevant product candidates. However, the in-licensing and acquisition of product candidates is a highly competitive area, and many other companies are pursuing the same or similar product candidates to those that we may consider attractive. In particular, larger companies with more well-established and diverse revenue streams may have a competitive advantage over us due to their size, financial resources and more extensive clinical development and commercialization capabilities. Furthermore, companies that perceive us to be a competitor may be unwilling to assign or license rights to us. We may also be unable to in-license or acquire additional relevant product candidates on acceptable terms that would allow us to realize an appropriate return on our investment. If we are unable to develop suitable product candidates through internal discovery efforts, whether due to the impacts of the ongoing COVID-19 pandemic or otherwise, or if we are unable to successfully obtain rights to additional suitable product candidates, our business and prospects for growth could suffer. Even if we succeed in our efforts to obtain rights to suitable product candidates, the competitive business environment may result in higher acquisition or licensing costs, and our investment in these potential products will remain subject to the inherent risks associated with the development and commercialization of new medicines. In certain circumstances, we may also be reliant on the licensor for the continued development of the in-licensed technology and their efforts to safeguard their underlying intellectual property.
With respect to acquisitions, we may not be able to integrate the target company successfully into our existing business, maintain the key business relationships of the target, or retain key personnel of an acquired business. Furthermore, we could assume unknown or contingent liabilities or incur unanticipated expenses. Any acquisitions or investments made by us also could result in our spending significant amounts, issuing dilutive securities, assuming or incurring significant debt obligations and contingent liabilities, incurring large one-time expenses and acquiring intangible assets that could result in significant future amortization expense and significant write-offs, any of which could harm our operating results.
Increasing use of social media could give rise to liability and may harm our business.
We and our employees are increasingly utilizing social media tools and our website as a means of communication. Despite our efforts to monitor evolving social media communication guidelines and comply with applicable laws and regulations, there is risk that the unauthorized use of social media by us or our employees to communicate about our products or business, or any inadvertent disclosure of material, nonpublic information through these means, may cause us to be found in violation of applicable laws and regulations, which may give rise to liability and result in harm to our business. In addition, there is also risk of inappropriate disclosure of sensitive information, which could result in significant legal and financial exposure and reputational damages that could potentially have an adverse impact on our business, financial condition and results of operations. Furthermore, negative posts or comments about us or our products on social media could seriously damage our reputation, brand image and goodwill.
Our future funding requirements will depend on many uncertain factors.
Our future funding requirements will depend upon many factors, many of which are beyond our control, including, but not limited to:
|
·
| |
the costs to commercialize fostamatinib for the treatment of ITP in the United States, or any other future product candidates, if any such candidate receives regulatory approval for commercial sale; |
|
·
| |
the progress and success of our Phase 3 trial in warm AIHA, other clinical trials and preclinical activities (including studies and manufacture of materials) of our product candidates conducted by us; |
|
·
| |
any current and future impacts of the ongoing and evolving COVID-19 pandemic; |
|
·
| |
the costs and timing of regulatory filings and approvals by us and our collaborators; |
|
·
| |
the progress of research and development programs carried out by us and our collaborative partners; |
|
·
| |
any changes in the breadth of our research and development programs; |
|
·
| |
the ability to achieve the events identified in our collaborative agreements that may trigger payments to us from our collaboration partners; |
|
·
| |
our ability to acquire or license other technologies or compounds that we may seek to pursue; |
|
·
| |
our ability to manage our growth; |
|
·
| |
competing technological and market developments; |
|
·
| |
the costs and timing of obtaining, enforcing and defending our patent and other intellectual property rights; and |
|
·
| |
expenses associated with any unforeseen litigation, including any arbitration and securities class action lawsuits. |
Insufficient funds may require us to delay, scale back or eliminate some or all of our commercial efforts and/or research and development programs, to reduce personnel and operating expenses, to lose rights under existing licenses or to relinquish greater or all rights to product candidates at an earlier stage of development or on less favorable terms than we would otherwise choose or may adversely affect our ability to operate as a going concern.
There is a high risk that drug discovery and development efforts might not generate successful product candidates.
At the present time, a significant portion of our operations are focused on various stages of drug identification and development. We currently have various product candidates in the clinical testing stage. In our industry, it is statistically unlikely that the limited number of compounds that we have identified as potential product candidates will actually lead to successful product development efforts. We have invested a significant portion of our efforts and financial resources into the development of fostamatinib. Our ability to generate product revenue, which will not occur until after regulatory approval, if ever, will depend on the successful development, regulatory approval and eventual commercialization of one of our product candidates.
Our compounds in clinical trials and our future leads for potential drug compounds are subject to the risks and failures inherent in the development of pharmaceutical products. These risks include, but are not limited to, the inherent difficulty in selecting the right drug and drug target and avoiding unwanted side effects, as well as unanticipated problems relating to product development, testing, enrollment, obtaining regulatory approvals, maintaining regulatory compliance, manufacturing, competition and costs and expenses that may exceed current estimates. In future clinical trials, we or our partners may discover additional side effects and/or higher frequency of side effects than those observed in previously completed clinical trials. The results of preliminary and mid-stage clinical trials do not necessarily predict clinical or commercial success, and larger later-stage clinical trials may fail to confirm the results observed in the previous clinical trials. Similarly, a clinical trial may show that a product candidate is safe and effective for certain patient populations in a particular indication, but other clinical trials may fail to confirm those results in a subset of that population or in a different patient population, which may limit the potential market for that product candidate. With respect to our own compounds in development, we have established anticipated timelines with respect to the initiation of clinical trials based on existing knowledge of the compounds. However, we cannot provide assurance that we will meet any of these timelines for clinical development. Additionally, the initial results of a completed earlier clinical trial of a product candidate do not necessarily predict final results and the results may not be repeated in later clinical trials.
Because of the uncertainty of whether the accumulated preclinical evidence (PK, pharmacodynamic, safety and/or other factors) or early clinical results will be observed in later clinical trials, we can make no assurances regarding the likely results from our future clinical trials or the impact of those results on our business. If our clinical trials fail to meet the primary efficacy endpoints, the commercial prospects of our business may be harmed, our ability to generate product revenues may be delayed or eliminated or we may be forced to undertake other strategic alternatives that are in our shareholders’ best interests, including cost reduction measures. If we are unable to obtain adequate financing or engage in a strategic transaction on commercially reasonable terms or at all, we may be required to implement further cost reduction strategies which could significantly impact activities related to our commercial efforts and/or research and development of our future product candidates, and could significantly harm our business, financial condition and results of operations. In addition, these cost reduction strategies could cause us to further curtail our operations or take other actions that would adversely impact our shareholders.
Delays in clinical testing could result in increased costs to us.*
We may not be able to initiate or continue clinical studies or trials for our product candidates if we are unable to locate and enroll a sufficient number of eligible patients to participate in these clinical trials as required by the FDA or other regulatory authorities, whether due to the impacts of the ongoing COVID-19 pandemic or otherwise. Even if we are able to enroll a sufficient number of patients in our clinical trials, if the pace of enrollment is slower than we expect, the development costs for our product candidates may increase and the completion of our clinical trials may be delayed, or our clinical trials could become too expensive to complete. Significant delays in clinical testing could negatively impact our product development costs and timing. Our estimates regarding timing are based on a number of assumptions, including assumptions based on past experience with our other clinical programs. If we are unable to enroll the patients in these trials at the projected rate, the completion of the clinical program could be delayed and the costs of conducting the program could increase, either of which could harm our business.
Clinical trials can be delayed for a variety of reasons, including delays in obtaining regulatory approval to commence a study, delays from scaling up of a study, delays in reaching agreement on acceptable clinical trial agreement
terms with prospective clinical sites, delays in obtaining institutional review board approval to conduct a study at a prospective clinical site or delays in recruiting subjects to participate in a study. In addition, we typically rely on third-party clinical investigators to conduct our clinical trials and other third-party organizations to oversee the operations of such trials and to perform data collection and analysis. The clinical investigators are not our employees, and we cannot control the amount or timing of resources that they devote to our programs. Failure of the third-party organizations to meet their obligations, whether due to the impacts of the ongoing COVID-19 pandemic or otherwise, could adversely affect clinical development of our products. As a result, we may face additional delaying factors outside our control if these parties do not perform their obligations in a timely fashion. For example, any number of those issues could arise with our clinical trials causing a delay. Delays of this sort could occur for the reasons identified above or other reasons. If we have delays in conducting the clinical trials or obtaining regulatory approvals, our product development costs will increase. For example, we may need to make additional payments to third-party investigators and organizations to retain their services or we may need to pay recruitment incentives. If the delays are significant, our financial results and the commercial prospects for our product candidates will be harmed, and our ability to become profitable will be delayed. Moreover, these third-party investigators and organizations may also have relationships with other commercial entities, some of which may compete with us. If these third-party investigators and organizations assist our competitors at our expense, it could harm our competitive position.
Due to the COVID-19 pandemic, for several of our development programs, we are experiencing a disruption or delay in our ability to initiate trial sites, enroll and assess patients, maintain patient enrollment, supply study drug, report trial results, or interact with regulators, ethics committees or other important agencies due to limitations in employee resources or otherwise. In addition, some patients may not be able or willing to comply with clinical trial protocols if quarantines impede patient movement or interrupt healthcare services. Similarly, our ability to recruit and retain patients and principal investigators and site staff who, as healthcare providers, may have heightened exposure to COVID-19 and adversely impact our clinical trial operations. In light of the ongoing COVID-19 pandemic, we have taken measures to implement remote and virtual approaches to clinical development, including remote patient monitoring where possible, and if the COVID-19 pandemic continues and persists for an extended period of time, we could experience significant disruptions to our clinical development timelines, which would adversely affect our business, financial condition, results of operations and growth prospects.
We have obtained orphan drug designation from the FDA for fostamatinib for the treatment of ITP and warm AIHA, but we may not be able to obtain or maintain orphan drug designation or exclusivity for fostamatinib for the treatment of ITP, warm AIHA or our other product candidates, or we may be unable to maintain the benefits associated with orphan drug designation, including the potential for market exclusivity.
We have obtained orphan drug designation in the United States for fostamatinib for the treatment of ITP and warm AIHA. We may seek orphan drug designation for other product candidates in the future. Under the Orphan Drug Act, the FDA may grant orphan drug designation to a drug or biologic intended to treat a rare disease or condition, which is defined as one occurring in a patient population of fewer than 200,000 in the United States, or a patient population greater than 200,000 in the United States where there is no reasonable expectation that the cost of developing the drug will be recovered from sales in the United States. In the United States, orphan drug designation entitles a party to financial incentives such as opportunities for grant funding towards clinical trial costs, tax advantages and user-fee waivers. In addition, if a product that has orphan drug designation subsequently receives the first FDA approval for the disease for which it has such designation, the product is entitled to orphan drug exclusivity, which means that the FDA may not approve any other applications, including a full NDA, to market the same drug for the same indication for seven years, except in limited circumstances, such as a showing of clinical superiority to the product with orphan drug exclusivity or where the manufacturer is unable to assure sufficient product quantity.
We cannot assure you that any future application for orphan drug designation with respect to any other product candidate will be granted. If we are unable to obtain orphan drug designation with respect to other product candidates in the United States, we will not be eligible to obtain the period of market exclusivity that could result from orphan drug designation or be afforded the financial incentives associated with orphan drug designation. Even though we have received orphan drug designation for fostamatinib for the treatment of ITP and warm AIHA, we may not be the first to obtain marketing approval for the orphan-designated indication due to the uncertainties associated with developing
pharmaceutical products. In addition, exclusive marketing rights in the United States for fostamatinib for the treatment of ITP, warm AIHA or any future product candidate may be limited if we seek approval for an indication broader than the orphan-designated indication or may be lost if the FDA later determines that the request for designation was materially defective or if the manufacturer is unable to assure sufficient quantities of the product to meet the needs of patients with the rare disease or condition. Further, even if we obtain orphan drug exclusivity for a product, that exclusivity may not effectively protect the product from competition because different drugs with different active moieties can be approved for the same condition. Even after an orphan product is approved, the FDA can subsequently approve the same drug with the same active moiety for the same condition if the FDA concludes that the later drug is safer, more effective, or makes a major contribution to patient care. Orphan drug designation neither shortens the development time or regulatory review time of a drug nor gives the drug any advantage in the regulatory review or approval process.
Our research and development efforts will be seriously jeopardized if we are unable to attract and retain key employees and relationships.
As a small company, our success depends on the continued contributions of our principal management and scientific personnel and on our ability to develop and maintain important relationships with leading academic institutions, scientists and companies in the face of intense competition for such personnel. In particular, our research programs depend on our ability to attract and retain highly skilled chemists, other scientists, and development, regulatory and clinical personnel. If we lose the services of any of our key personnel, our research and development efforts could be seriously and adversely affected. Our employees can terminate their employment with us at any time.
Our success as a company is uncertain due to our history of operating losses and the uncertainty of any future profitability.
We incurred a loss from operations of approximately $65.2 million during the year ended December 31, 2019. Other than for 2010, we have historically incurred losses from operations each year since we were incorporated in June 1996, due in large part to the significant research and development expenditures required to identify and validate new product candidates and pursue our development efforts, and the costs of our ongoing commercial efforts for TAVALISSE. We expect to continue to incur losses from operations, at least in the next twelve months, and there can be no assurance that we will generate annual operating income in the foreseeable future. Currently, our potential sources of revenues are our sales of TAVALISE, upfront payments, research and development contingent payments and royalty payments pursuant to our collaboration arrangements, which may never materialize if our collaborators do not achieve certain events or generate net sales to which these contingent payments are dependent on. If our future drug candidates fail or do not gain regulatory approval, or if our drugs do not achieve sustainable market acceptance, we may not be profitable. As of March 31, 2020, we had an accumulated deficit of approximately $1.3 billion. The extent of our future losses or profitability, if any, especially due to the ongoing COVID-19 pandemic, is highly uncertain.
If our corporate collaborations or license agreements are unsuccessful, or if we fail to form new corporate collaborations or license agreements, our research and development efforts could be delayed.
Our strategy depends upon the formation and sustainability of multiple collaborative arrangements and license agreements with third parties now and in the future. We rely on these arrangements for not only financial resources, but also for expertise we need now and in the future relating to clinical trials, manufacturing, sales and marketing, and for licenses to technology rights. To date, we have entered into several such arrangements with corporate collaborators; however, we do not know if these collaborations or additional collaborations with third parties, if any, will dedicate sufficient resources or if any development or commercialization efforts by third parties will be successful. In addition, our corporate collaborators may delay clinical trials, provide insufficient funding for a clinical trial program, stop a clinical trial or abandon a drug candidate or development program. Should a collaborative partner fail to develop or commercialize a compound or product to which it has rights from us for any reason, including corporate restructuring, such failure might delay our ongoing research and development efforts, because we might not receive any future payments, and we would not receive any royalties associated with such compound or product. We are conducting a Phase 3 clinical program to study fostamatinib in AIHA on our own. We may seek another collaborator or licensee in the future for clinical development and commercialization of fostamatinib, as well as our other clinical programs, which we
may not be able to obtain on commercially reasonable terms or at all. If we are unable to form new collaborations or enter into new license agreements, our research and development efforts could be delayed. In addition, the continuation of some of our partnered drug discovery and development programs may be dependent on the periodic renewal of our corporate collaborations.
Each of our collaborations could be terminated by the other party at any time, and we may not be able to renew these collaborations on acceptable terms, if at all, or negotiate additional corporate collaborations on acceptable terms, if at all. If these collaborations terminate or are not renewed, any resultant loss of revenues from these collaborations or loss of the resources and expertise of our collaborative partners could adversely affect our business.
Conflicts also might arise with collaborative partners concerning proprietary rights to particular compounds. While our existing collaborative agreements typically provide that we retain milestone payments, royalty rights and/or revenue sharing with respect to drugs developed from certain compounds or derivative compounds, any such payments or royalty rights may be at reduced rates, and disputes may arise over the application of payment provisions or derivative payment provisions to such drugs, and we may not be successful in such disputes. For example, in September 2018, BerGenBio served us with a notice of arbitration seeking declaratory relief related to the interpretation of provisions under our June 2011 license agreement, particularly as they relate to the rights and obligations of the parties in the event of the license or sale of a product in the program by BerGenBio and/or the sale of BerGenBio to a third party. The arbitration panel dismissed four of the six declarations sought by BerGenBio, and we thereafter consented to one of the remaining declarations requested by BerGenBio. On February 27, 2019, the arbitration panel issued a determination granting the declaration sought by BerGenBio on the remaining issue, and held that in the event of a sale of shares by BerGenBio’s shareholders where there is no monetary benefit to BerGenBio, we would not be entitled to a portion of the proceeds from such a sale. In this circumstance where the revenue share provision is not triggered, the milestone and royalty payment provisions remain in effect. While we do not believe that the determination will have an adverse effect on our operations, cash flows or financial condition, we can make no assurance regarding any such impact. Additionally, the management teams of our collaborators may change for various reasons including due to being acquired. Different management teams or an acquiring company of our collaborators may have different priorities which may have adverse results on the collaboration with us.
We are also a party to various license agreements that give us rights to use specified technologies in our research and development processes. The agreements pursuant to which we have in-licensed technology permit our licensors to terminate the agreements under certain circumstances. If we are not able to continue to license these and future technologies on commercially reasonable terms, our product development and research may be delayed or otherwise adversely affected.
If conflicts arise between our collaborators or advisors and us, any of them may act in their self-interest, which may be adverse to our stockholders’ interests.
If conflicts arise between us and our corporate collaborators or scientific advisors, the other party may act in its self-interest and not in the interest of our stockholders. Some of our corporate collaborators are conducting multiple product development efforts within each disease area that is the subject of the collaboration with us or may be acquired or merged with a company having a competing program. In some of our collaborations, we have agreed not to conduct, independently or with any third party, any research that is competitive with the research conducted under our collaborations. Our collaborators, however, may develop, either alone or with others, products in related fields that are competitive with the products or potential products that are the subject of these collaborations. Competing products, either developed by our collaborators or to which our collaborators have rights, may result in their withdrawal of support for our product candidates.
If any of our corporate collaborators were to breach or terminate its agreement with us or otherwise fail to conduct the collaborative activities successfully and in a timely manner, the preclinical or clinical development or commercialization of the affected product candidates or research programs could be delayed or terminated. We generally do not control the amount and timing of resources that our corporate collaborators devote to our programs or potential products. We do not know whether current or future collaborative partners, if any, might pursue alternative technologies
or develop alternative products either on their own or in collaboration with others, including our competitors, as a means for developing treatments for the diseases targeted by collaborative arrangements with us.
Our success is dependent on intellectual property rights held by us and third parties, and our interest in such rights is complex and uncertain.
Our success will depend to a large part on our own, our licensees’ and our licensors’ ability to obtain and defend patents for each party’s respective technologies and the compounds and other products, if any, resulting from the application of such technologies. For example, fostamatinib is covered as a composition of matter in a U.S. issued patent that has an expected expiration date of September 2031, after taking into account patent term adjustment and extension rules.
In the future, our patent position might be highly uncertain and involve complex legal and factual questions. For example, we may be involved in post-grant proceedings before the United States Patent and Trademark Office. Post-grant proceedings are complex and expensive legal proceedings and there is no assurance we will be successful in any such proceedings. A post-grant proceeding could result in our losing our patent rights and/or our freedom to operate and/or require us to pay significant royalties. Additional uncertainty may result because no consistent policy regarding the breadth of legal claims allowed in biotechnology patents has emerged to date. Accordingly, we cannot predict the breadth of claims allowed in our or other companies’ patents.
Because the degree of future protection for our proprietary rights is uncertain, we cannot assure you that:
|
·
| |
we were the first to make the inventions covered by each of our pending patent applications; |
|
·
| |
we were the first to file patent applications for these inventions; |
|
·
| |
others will not independently develop similar or alternative technologies or duplicate any of our technologies; |
|
·
| |
any of our pending patent applications will result in issued patents; |
|
·
| |
any patents issued to us or our collaborators will provide a basis for commercially-viable products or will provide us with any competitive advantages or will not be challenged by third parties; |
|
·
| |
we will develop additional proprietary technologies that are patentable; or |
|
·
| |
the patents of others will not have a negative effect on our ability to do business. |
We rely on trade secrets to protect technology where we believe patent protection is not appropriate or obtainable; however, trade secrets are difficult to protect. While we require employees, collaborators and consultants to enter into confidentiality agreements, we may not be able to adequately protect our trade secrets or other proprietary information in the event of any unauthorized use or disclosure or the lawful development by others of such information.
We are a party to certain in-license agreements that are important to our business, and we generally do not control the prosecution of in-licensed technology. Accordingly, we are unable to exercise the same degree of control over this intellectual property as we exercise over our internally-developed technology. Moreover, some of our academic institution licensors, research collaborators and scientific advisors have rights to publish data and information in which we have rights. If we cannot maintain the confidentiality of our technology and other confidential information in connection with our collaborations, our ability to receive patent protection or protect our proprietary information may otherwise be impaired. In addition, some of the technology we have licensed relies on patented inventions developed using U.S. government resources.
The U.S. government retains certain rights, as defined by law, in such patents, and may choose to exercise such rights. Certain of our in-licenses may be terminated if we fail to meet specified obligations. If we fail to meet such obligations and any of our licensors exercise their termination rights, we could lose our rights under those agreements. If we lose any of our rights, it may adversely affect the way we conduct our business. In addition, because certain of our licenses are sublicenses, the actions of our licensors may affect our rights under those licenses.
If a dispute arises regarding the infringement or misappropriation of the proprietary rights of others, such dispute could be costly and result in delays in our research and development activities and partnering.
Our success will depend, in part, on our ability to operate without infringing or misappropriating the proprietary rights of others. There are many issued patents and patent applications filed by third parties relating to products or processes that are similar or identical to our licensors or ours, and others may be filed in the future. There may also be copyrights or trademarks that third parties hold. There can be no assurance that our activities, or those of our licensors, will not violate intellectual property rights of others. We believe that there may be significant litigation in the industry regarding patent and other intellectual property rights, and we do not know if our collaborators or we would be successful in any such litigation. Any legal action against our collaborators or us claiming damages or seeking to enjoin commercial activities relating to the affected products, our methods or processes could:
|
·
| |
require our collaborators or us to obtain a license to continue to use, manufacture or market the affected products, methods or processes, which may not be available on commercially reasonable terms, if at all; |
|
·
| |
prevent us from using the subject matter claimed in the patents held by others; |
|
·
| |
subject us to potential liability for damages; |
|
·
| |
consume a substantial portion of our managerial and financial resources; and |
|
·
| |
result in litigation or administrative proceedings that may be costly, whether we win or lose. |
Our effective tax rate may fluctuate, and we may incur obligations in tax jurisdictions in excess of accrued amounts.
We are subject to taxation in numerous U.S. states and territories. As a result, our effective tax rate is derived from a combination of applicable tax rates in the various places that we operate. In preparing our financial statements, we estimate the amount of tax that will become payable in each of such places. Nevertheless, our effective tax rate may be different than experienced in the past due to numerous factors, including passage of the newly enacted federal income tax law, changes in the mix of our profitability from state to state, the results of examinations and audits of our tax filings, our inability to secure or sustain acceptable agreements with tax authorities, changes in accounting for income taxes and changes in tax laws. Any of these factors could cause us to experience an effective tax rate significantly different from previous periods or our current expectations and may result in tax obligations in excess of amounts accrued in our financial statements.
Recent changes and possible future changes in tax laws or regulations could adversely affect our business and financial condition.*
On December 22, 2017, President Trump signed into law the Tax Cuts and Jobs Act of 2017, or Tax Act, which significantly revised the Internal Revenue Code of 1986, as amended, or the Code. Future guidance from the U.S. Internal Revenue Service and other tax authorities with respect to the Tax Act may affect us, and certain aspects of the Tax Act could be repealed or modified in future legislation. Changes in corporate tax rates, the realization of net deferred tax assets relating to our U.S. operations, the taxation of foreign earnings, and the deductibility of expenses under the Tax Act or future tax reform legislation could have a material impact on the value of our deferred tax assets, could result in significant one-time charges in the current or future taxable years, and could increase our future U.S. tax expense. The foregoing items, as well as any other future changes in tax laws, could have a material adverse effect on our business,
cash flow, financial condition, or results of operations. In addition, it is uncertain if and to what extent various states will conform to the Tax Act or any newly enacted federal tax legislation.
On March 27, 2020, President Trump signed into law the Coronavirus Aid, Relief, and Economic Security Act, or CARES Act, which provides temporary relief from certain aspects of the Tax Act that had imposed limitations on the utilization of certain losses, interest expense deductions, and minimum tax credits. We are currently in the process of assessing the tax-related provisions of the CARES Act and its potential impact on us.
Our ability to use net operating losses and certain other tax attributes is uncertain and may be limited.*
Our ability to use our federal and state NOLs to offset potential future taxable income and related income taxes that would otherwise be due is dependent upon our generation of future taxable income before the expiration dates of the NOLs, and we cannot predict with certainty when, or whether, we will generate sufficient taxable income to use all of our NOLs. Federal NOLs generated prior to 2018 will continue to be governed by the NOL carryforward rules as they existed prior to the adoption of the Tax Act, which means that generally they will expire 20 years after they were generated if not used prior thereto. Many states have similar laws. Accordingly, our federal and state NOLs could expire unused and be unavailable to offset future income tax liabilities. Under the Tax Act as modified by the CARES Act, federal NOLs incurred in tax years beginning after December 31, 2017 and before January 1, 2021 may be carried back to each of the five tax years preceding such loss, and NOLs arising in tax years beginning after December 31, 2020 may not be carried back. Moreover, federal net operating losses generated in tax years ending after December 31, 2017 may be carried forward indefinitely, but the deductibility of such federal NOLs may be limited to 80% of current year taxable income for tax years beginning after January 1, 2021. In addition, utilization of net operating losses to offset potential future taxable income and related income taxes that would otherwise be due is subject to annual limitations under the “ownership change” provisions of Sections 382 and 383 of the Internal Revenue Code of 1986, as amended (Internal Revenue Code) and similar state provisions, which may result in the expiration of net operating losses before future utilization. In general, under the Code, if a corporation undergoes an “ownership change,” generally defined as a greater than 50% change (by value) in its equity ownership over a three-year period, the corporation’s ability to use its pre-change net operating losses and other pre-change tax attributes (such as research and development credit carryforwards) to offset its post-change taxable income or taxes may be limited. Our equity offerings and other changes in our stock ownership, some of which are outside of our control, may have resulted or could in the future result in an ownership change. Although we have completed studies to provide reasonable assurance that an ownership change limitation would not apply, we cannot be certain that a taxing authority would reach the same conclusion. If, after a review or audit, an ownership change limitation were to apply, utilization of our domestic net operating losses and tax credit carryforwards could be limited in future periods and a portion of the carryforwards could expire before being available to reduce future income tax liabilities. Moreover, our ability to utilize our net operating losses is conditioned upon us achieving profitability and generating U.S. federal taxable income.
Because we expect to be dependent upon collaborative and license agreements, we might not meet our strategic objectives.
Our ability to generate revenue in the near term depends on the timing of recognition of certain upfront payments, achievement of certain payment triggering events with our existing collaboration agreements and our ability to enter into additional collaborative agreements with third parties. Our ability to enter into new collaborations and the revenue, if any, that may be recognized under these collaborations is highly uncertain. If we are unable to enter into one or more new collaborations, our business prospects could be harmed, which could have an immediate adverse effect on our ability to continue to develop our compounds and on the trading price of our stock. Our ability to enter into a collaboration may be dependent on many factors, such as the results of our clinical trials, competitive factors and the fit of one of our programs with another company’s risk tolerance, including toward regulatory issues, patent portfolio, clinical pipeline, the stage of the available data, particularly if it is early, overall corporate goals and financial position.
To date, a portion of our revenues have been related to the research or transition phase of each of our collaborative agreements. Such revenues are for specified periods, and the impact of such revenues on our results of operations is at least partially offset by corresponding research costs. Following the completion of the research or transition phase of each collaborative agreement, additional revenues may come only from payments triggered by milestones and/or the achievement of other contingent events, and royalties, which may not be paid, if at all, until certain conditions are met. This risk is heightened due to the fact that unsuccessful research efforts may preclude us from receiving any contingent payments under these agreements. Our receipt of revenues from collaborative arrangements is also significantly affected by the timing of efforts expended by us and our collaborators and the timing of lead compound identification. We have received payments from our collaborations with Grifols, Kissei, Medison, Aclaris, Celgene, BMS, AZ, BerGenBio, Janssen Pharmaceutica N.V., a division of Johnson & Johnson, Novartis Pharma A.G., Daiichi, Merck & Co., Inc., Merck Serono and Pfizer. Under many agreements, future payments may not be earned until the collaborator has advanced product candidates into clinical testing, which may never occur or may not occur until sometime well into the future. If we are not able to generate revenue under our collaborations when and in accordance with our expectations or the expectations of industry analysts, this failure could harm our business and have an immediate adverse effect on the trading price of our common stock.
Our business requires us to generate meaningful revenue from royalties and licensing agreements. To date, we have not received any revenue from royalties for the commercial sale of drugs, and we do not know when we will receive any such revenue, if at all.
Securities class action lawsuits or other litigation could result in substantial damages and may divert management’s time and attention from our business.
We have been subject to class action lawsuits in the past and we may be subject to lawsuits in the future, such as those that might occur if there was to be a change in our corporate strategy. These and other lawsuits are subject to inherent uncertainties, and the actual costs to be incurred relating to the lawsuit will depend upon many unknown factors. The outcome of litigation is necessarily uncertain, and we could be forced to expend significant resources in the defense of such suits, and we may not prevail. Monitoring and defending against legal actions is time-consuming for our management and detracts from our ability to fully focus our internal resources on our business activities. In addition, we may incur substantial legal fees and costs in connection with any such litigation. We have not established any reserves for any potential liability relating to any such potential lawsuits. It is possible that we could, in the future, incur judgments or enter into settlements of claims for monetary damages. A decision adverse to our interests on any such actions could result in the payment of substantial damages, or possibly fines, and could have an adverse effect on our cash flow, results of operations and financial position.
Global economic conditions could adversely impact our business.
The U.S. government has indicated its intent to alter its approach to international trade policy and in some cases to renegotiate, or potentially terminate, certain existing bilateral or multi-lateral trade agreements and treaties with foreign countries. In addition, the U.S. government has initiated or is considering imposing tariffs on certain foreign goods. Related to this action, certain foreign governments, including China, have instituted or are considering imposing tariffs on certain U.S. goods. It remains unclear what the U.S. Administration or foreign governments will or will not do with respect to tariffs or other international trade agreements and policies. A trade war or other governmental action related to tariffs or international trade agreements or policies has the potential to disrupt our research activities, affect our suppliers and/or the U.S. economy or certain sectors thereof and, thus, could adversely impact our businesses.
If our competitors develop technologies that are more effective than ours, our commercial opportunity will be reduced or eliminated.
The biotechnology and pharmaceutical industries are intensely competitive and subject to rapid and significant technological change. Many of the drugs that we are attempting to discover will be competing with existing therapies. In addition, a number of companies are pursuing the development of pharmaceuticals that target the same diseases and conditions that we are targeting. For example, the commercialization of new pharmaceutical products is highly competitive, and we face substantial competition with respect to TAVALISSE in which there are existing therapies and drug candidates in development for the treatment of ITP that may be alternative therapies to TAVALISSE. Many of our competitors, including a number of large pharmaceutical companies that compete directly with us, have significantly greater financial resources and expertise commercializing approved products than we do. Also, many of our competitors are large pharmaceutical companies that will have a greater ability to reduce prices for their competing drugs in an effort to gain market share and undermine the value proposition that we might otherwise be able to offer to payers. We face, and will continue to face, intense competition from pharmaceutical and biotechnology companies, as well as from academic and research institutions and government agencies, both in the United States and abroad. Some of these competitors are pursuing the development of pharmaceuticals that target the same diseases and conditions as our research programs. Our competitors including fully integrated pharmaceutical companies have extensive drug discovery efforts and are developing novel small-molecule pharmaceuticals. We also face significant competition from organizations that are pursuing the same or similar technologies, including the discovery of targets that are useful in compound screening, as the technologies used by us in our drug discovery efforts.
Competition may also arise from:
|
·
| |
new or better methods of target identification or validation; |
|
·
| |
generic version of TAVALISSE or of products with which we compete; |
|
·
| |
other drug development technologies and methods of preventing or reducing the incidence of disease; |
|
·
| |
new small molecules; or |
|
·
| |
other classes of therapeutic agents. |
Our competitors or their collaborative partners may utilize discovery technologies and techniques or partner with collaborators in order to develop products more rapidly or successfully than we or our collaborators are able to do. Many of our competitors, particularly large pharmaceutical companies, have substantially greater financial, technical and human resources and larger research and development staffs than we do. In addition, academic institutions, government agencies and other public and private organizations conducting research may seek patent protection with respect to potentially competitive products or technologies and may establish exclusive collaborative or licensing relationships with our competitors.
We believe that our ability to compete is dependent, in part, upon our ability to create, maintain and license scientifically-advanced technology and upon our and our collaborators’ ability to develop and commercialize pharmaceutical products based on this technology, as well as our ability to attract and retain qualified personnel, obtain patent protection or otherwise develop proprietary technology or processes and secure sufficient capital resources for the expected substantial time period between technological conception and commercial sales of products based upon our technology. The failure by any of our collaborators or us in any of those areas may prevent the successful commercialization of our potential drug targets.
Many of our competitors, either alone or together with their collaborative partners, have significantly greater experience than we do in:
|
·
| |
identifying and validating targets; |
|
·
| |
screening compounds against targets; and |
|
·
| |
undertaking preclinical testing and clinical trials. |
Accordingly, our competitors may succeed in obtaining patent protection, identifying or validating new targets or discovering new drug compounds before we do.
Our competitors might develop technologies and drugs that are more effective or less costly than any that are being developed by us or that would render our technology and product candidates obsolete and noncompetitive. In addition, our competitors may succeed in obtaining the approval of the FDA or other regulatory agencies for product candidates more rapidly. Companies that complete clinical trials, obtain required regulatory agency approvals and commence commercial sale of their drugs before us may achieve a significant competitive advantage, including certain patent and FDA marketing exclusivity rights that would delay or prevent our ability to market certain products. Any drugs resulting from our research and development efforts, or from our joint efforts with our existing or future collaborative partners, might not be able to compete successfully with competitors’ existing or future products or obtain regulatory approval in the United States or elsewhere.
We face and will continue to face intense competition from other companies for collaborative arrangements with pharmaceutical and biotechnology companies, for establishing relationships with academic and research institutions and for licenses to additional technologies. These competitors, either alone or with their collaborative partners, may succeed in developing technologies or products that are more effective than ours.
Our ability to compete successfully will depend, in part, on our ability to:
|
·
| |
identify and validate targets; |
|
·
| |
discover candidate drug compounds that interact with the targets we identify; |
|
·
| |
attract and retain scientific and product development personnel; |
|
·
| |
obtain patent or other proprietary protection for our new drug compounds and technologies; and |
|
·
| |
enter commercialization agreements for our new drug compounds. |
Our stock price may be volatile, and our stockholders’ investment in our common stock could decline in value.
The market prices for our common stock and the securities of other biotechnology companies have been highly volatile and may continue to be highly volatile in the future. The following factors, in addition to other risk factors described in this section, may have a significant impact on the market price of our common stock:
|
·
| |
the progress and success of our clinical trials and preclinical activities (including studies and manufacture of materials) of our product candidates conducted by us; |
|
·
| |
our ability to continue to sell TAVALISSE in the United States; |
|
·
| |
our ability to enter into partnering opportunities across our pipeline; |
|
·
| |
the receipt or failure to receive the additional funding necessary to conduct our business; |
|
·
| |
selling by large stockholders; |
|
·
| |
presentations of detailed clinical trial data at medical and scientific conferences and investor perception thereof; |
|
·
| |
announcements of technological innovations or new commercial products by our competitors or us; |
|
·
| |
developments concerning proprietary rights, including patents; |
|
·
| |
developments concerning our collaborations; |
|
·
| |
publicity regarding actual or potential medical results relating to products under development by our competitors or us; |
|
·
| |
regulatory developments in the United States and foreign countries; |
|
·
| |
changes in the structure of healthcare payment systems; |
|
·
| |
litigation or arbitration; |
|
·
| |
economic and other external factors or other disaster or crisis; and |
|
·
| |
period-to-period fluctuations in financial results. |
If we fail to continue to meet the listing standards of Nasdaq, our common stock may be delisted, which could have an adverse effect on the liquidity of our common stock.
Our common stock is currently listed on the Nasdaq Global Market. The Nasdaq Stock Market LLC has requirements that a company must meet in order to remain listed on Nasdaq. In particular, Nasdaq rules require us to maintain a minimum bid price of $1.00 per share of our common stock. If the closing bid price of our common stock were to fall below $1.00 per share for 30 consecutive trading days or we do not meet other listing requirements, we would fail to be in compliance with Nasdaq listing standards. There can be no assurance that we will continue to meet the minimum bid price requirement, or any other requirement in the future. If we fail to meet the minimum bid price requirement, The Nasdaq Stock Market LLC may initiate the delisting process with a notification letter. If we were to receive such a notification, we would be afforded a grace period of 180 calendar days to regain compliance with the minimum bid price requirement. In order to regain compliance, shares of our common stock would need to maintain a minimum closing bid price of at least $1.00 per share for a minimum of 10 consecutive trading days. In addition, we may be unable to meet other applicable Nasdaq listing requirements, including maintaining minimum levels of stockholders’ equity or market values of our common stock in which case, our common stock could be delisted. If our common stock were to be delisted, the liquidity of our common stock would be adversely affected, and the market price of our common stock could decrease.
The withdrawal of the U.K. from the E.U. may adversely impact our ability to obtain regulatory approvals of our product candidates in the E.U., result in restrictions or imposition of taxes and duties for importing our product candidates into the E.U., and may require us to incur additional expenses in order to develop, manufacture and commercialize our product candidates in the E.U.
Following the result of a referendum in 2016, the U.K. left the E.U. on January 31, 2020, commonly referred to as Brexit. Pursuant to the formal withdrawal arrangements agreed between the U.K. and the E.U., the U.K. will be subject to a transition period until December 31, 2020, or the Transition Period, during which E.U. rules will continue to apply. Negotiations between the U.K. and the E.U. are expected to continue in relation to the customs and trading relationship between the U.K. and the E.U. following the expiry of the Transition Period.
Since a significant proportion of the regulatory framework in the U.K. applicable to our business and our product candidates is derived from E.U. directives and regulations, Brexit, following the Transition Period, could adversely impact the regulatory regime with respect to the development, manufacture, importation, approval and commercialization of our product candidates in the U.K. or the E.U. For example, as a result of the uncertainty
surrounding Brexit, the EMA relocated to Amsterdam from London. Following the Transition Period, the U.K. will no longer be covered by the centralized procedures for obtaining E.U-wide marketing authorization from the EMA and, unless a specific agreement is entered into, a separate process for authorization of drug products, including our product candidates, will be required in the U.K., the potential process for which is currently unclear. Any delay in obtaining, or an inability to obtain, any marketing approvals, as a result of Brexit or otherwise, would prevent us from commercializing our product candidates in the U.K. or the E.U. and restrict our ability to generate revenue and achieve and sustain profitability. In addition, we may be required to pay taxes or duties or be subjected to other hurdles in connection with the importation of our product candidates into the E.U., or we may incur expenses in establishing a manufacturing facility in the E.U. in order to circumvent such hurdles. If any of these outcomes occur, we may be forced to restrict or delay efforts to seek regulatory approval in the U.K. or the E.U. for our product candidates, or incur significant additional expenses to operate our business, which could significantly and materially harm or delay our ability to generate revenues or achieve profitability of our business. Any further changes in international trade, tariff and import/export regulations as a result of Brexit or otherwise may impose unexpected duty costs or other non-tariff barriers on us. These developments, or the perception that any of them could occur, may significantly reduce global trade and, in particular, trade between the impacted nations and the U.K.
If product liability lawsuits are successfully brought against us, we may incur substantial liabilities and may be required to limit commercialization of our products.
The testing and marketing of medical products and the sale of any products for which we obtain marketing approval exposes us to the risk of product liability claims. Product liability claims might be brought against us by consumers, health care providers, pharmaceutical companies or others selling or otherwise coming into contact with our products. If we cannot successfully defend ourselves against product liability claims, we may incur substantial liabilities or be required to limit commercialization of our products. We carry product liability insurance that is limited in scope and amount and may not be adequate to fully protect us against product liability claims. If and when we obtain marketing approval for our product candidates, we intend to expand our insurance coverage to include the sale of commercial products; however, we may be unable to obtain product liability insurance on commercially reasonable terms or in adequate amounts. Our inability to obtain sufficient product liability insurance at an acceptable cost to protect against potential product liability claims could prevent or inhibit the commercialization of pharmaceutical products we develop, alone or with corporate collaborators. We, or our corporate collaborators, might not be able to obtain insurance at a reasonable cost, if at all. While under various circumstances we are entitled to be indemnified against losses by our corporate collaborators, indemnification may not be available or adequate should any claim arise.
We depend on various scientific consultants and advisors for the success and continuation of our research and development efforts.
We work extensively with various scientific consultants and advisors. The potential success of our drug discovery and development programs depends, in part, on continued collaborations with certain of these consultants and advisors. We, and various members of our management and research staff, rely on certain of these consultants and advisors for expertise in our research, regulatory and clinical efforts. Our scientific advisors are not our employees and may have commitments to, or consulting or advisory contracts with, other entities that may limit their availability to us. We do not know if we will be able to maintain such consulting agreements or that such scientific advisors will not enter into consulting arrangements, exclusive or otherwise, with competing pharmaceutical or biotechnology companies, any of which would have a detrimental impact on our research objectives and could have an adverse effect on our business, financial condition and results of operations.
If we use biological and hazardous materials in a manner that causes injury or violates laws, we may be liable for damages, penalties or fines.
Our research and development activities involve the controlled use of potentially harmful biological materials as well as hazardous materials, chemicals, animals, and various radioactive compounds. We cannot completely eliminate the risk of accidental contamination or injury from the use, storage, handling or disposal of these animals and materials. In the event of contamination or injury, we could be held liable for damages that result or for penalties or fines that may
be imposed, and such liability could exceed our resources. We are also subject to federal, state and local laws and regulations governing the use, storage, handling and disposal of these materials and specified waste products. The cost of compliance with, or any potential violation of, these laws and regulations could be significant.
Our internal computer systems, or those used by our contract research organizations or other contractors or consultants, may fail or suffer security breaches.
Despite the implementation of security measures, our internal computer systems and those of our contract research organizations and other contractors and consultants are vulnerable to damage from computer viruses, unauthorized access, natural disasters, terrorism, war and telecommunication and electrical failures. While we have not experienced any such system failure, accident or security breach to date, if such an event were to occur and cause interruptions in our operations, it could result in a disruption of our drug development programs. For example, the loss of clinical trial data from completed or ongoing clinical trials for a product candidate could result in delays in our regulatory approval efforts and significantly increase our costs to recover or reproduce the data. To the extent that any disruption or security breach were to result in a loss of or damage to our data or applications, or inappropriate disclosure of confidential or proprietary information, we could incur liability, incur significant remediation or litigation costs, result in product development delays, disrupt key business operations and divert attention of management and key information technology resources.
Companies have been increasingly subject to a wide variety of security incidents, cyber-attacks and other attempts to gain unauthorized access or otherwise compromise information technology systems. These threats can come from a variety of sources, ranging in sophistication from an individual hacker to a state-sponsored attack and motive including corporate espionage. Cyber threats may be generic, or they may be custom-crafted against our information systems. Cyber-attacks continue to become more prevalent and much harder to detect and defend against. Our network and storage applications and those of our contract manufacturing organizations, contract research organizations or vendors may be subject to unauthorized access by hackers or breached due to operator error, malfeasance or other system disruptions. It is often difficult to anticipate or immediately detect such incidents and the damage caused by such incidents. These data breaches and any unauthorized access or disclosure of our information or intellectual property could compromise our intellectual property and expose our sensitive business information. Any such event that leads to unauthorized access, use or disclosure of personal information, including personal information regarding our patients or employees, could harm our reputation and business, compel us to comply with federal and/or state breach notification laws and foreign law equivalents, subject us to investigations and mandatory corrective action, and otherwise subject us to liability under laws and regulations that protect the privacy and security of personal information, which could disrupt our business, result in increased costs or loss of revenue, or result in significant financial exposure. Furthermore, the costs of maintaining or upgrading our cyber-security systems at the level necessary to keep up with our expanding operations and prevent against potential attacks are increasing, and despite our best efforts, our network security and data recovery measures and those of our vendors may still not be adequate to protect against such security breaches and disruptions, which could cause harm to our business, financial condition and results of operations.
The transition away from the London Interbank Offered Rate (LIBOR) could affect the value of certain short-term investments, outstanding debt from our existing credit facility as well as our ability to draw additional funds from our credit facility.
The UK's Financial Conduct Authority, which regulates LIBOR, has announced plans to phase out the use of LIBOR by the end of 2021. We have certain short-term investments which includes financial instruments, as well an existing debt facility subject to LIBOR. There remains uncertainty regarding the future utilization of LIBOR and the nature of any replacement rate, and any potential effects of the transition away from LIBOR on certain instruments in to which we may enter in the future are not known. The transition process may involve, among other things, increased volatility or illiquidity in markets for instruments that currently rely on LIBOR. The transition may also result in reductions in the value of certain instruments or the effectiveness of related transactions such as hedges, increased borrowing costs, uncertainty under applicable documentation, or difficult and costly consent processes. Any such effects
of the transition away from LIBOR, as well as other unforeseen effects, result in expenses, difficulties, complications or delays in connection with future financing efforts, which could have an adverse impact on our business, financial condition and results of operations.
Our facilities are located near known earthquake fault zones, and the occurrence of an earthquake or other catastrophic disaster could cause damage to our facilities and equipment, which could require us to cease or curtail operations.
Our facilities are located in the San Francisco Bay Area near known earthquake fault zones and are vulnerable to significant damage from earthquakes. We are also vulnerable to damage from other types of disasters, including fires, floods, power loss, communications failures and similar events. If any disaster were to occur, our ability to operate our business at our facilities would be seriously, or potentially completely, impaired, and our research could be lost or destroyed. In addition, the unique nature of our research activities and of much of our equipment could make it difficult for us to recover from a disaster. The insurance we maintain may not be adequate to cover our losses resulting from disasters or other business interruptions.
Future equity issuances or a sale of a substantial number of shares of our common stock may cause the price of our common stock to decline.
Because we will continue to need additional capital in the future to continue to expand our business and our research and development activities, among other things, we may conduct additional equity offerings. For example, under the universal shelf registration statement filed by us in March 2018 and declared effective by the SEC in April 2018, we may offer and sell any combination of common stock, preferred stock, debt securities and warrants in one or more offerings, up to a cumulative value of $200 million. To date, we have $128.2 million remaining under such universal shelf registration statement. If we or our stockholders sell, or if it is perceived that we or they will sell, substantial amounts of our common stock (including shares issued upon the exercise of options and warrants) in the public market, the market price of our common stock could fall. A decline in the market price of our common stock could make it more difficult for us to sell equity or equity-related securities in the future at a time and price that we deem appropriate. Furthermore, if we obtain funds through a credit facility or through the issuance of debt or preferred securities, these securities would likely have rights senior to the rights of our common stockholders, which could impair the value of our common stock.
Anti-takeover provisions in our charter documents and under Delaware law may make an acquisition of us, which may be beneficial to our stockholders, more difficult.
Provisions of our amended and restated certificate of incorporation and bylaws, as well as provisions of Delaware law, could make it more difficult for a third party to acquire us, even if doing so would benefit our stockholders. These provisions:
|
·
| |
establish that members of the board of directors may be removed only for cause upon the affirmative vote of stockholders owning a majority of our capital stock; |
|
·
| |
authorize the issuance of “blank check” preferred stock that could be issued by our board of directors to increase the number of outstanding shares and thwart a takeover attempt; |
|
·
| |
limit who may call a special meeting of stockholders; |
|
·
| |
prohibit stockholder action by written consent, thereby requiring all stockholder actions to be taken at a meeting of our stockholders; |
|
·
| |
establish advance notice requirements for nominations for election to the board of directors or for proposing matters that can be acted upon at stockholder meetings; |
|
·
| |
provide for a board of directors with staggered terms; and |
|
·
| |
provide that the authorized number of directors may be changed only by a resolution of our board of directors. |
In addition, Section 203 of the Delaware General Corporation Law, which imposes certain restrictions relating to transactions with major stockholders, may discourage, delay or prevent a third party from acquiring us.
Item 2.Unregistered Sales of Equity Securities and Use of Proceeds
None.
Item 3.Defaults Upon Senior Securities
None.
Item 4.Mine Safety Disclosures
Not applicable.
Item 5.Other Information
None.
Item 6.Exhibits
The exhibits listed on the accompanying index to exhibits are filed or incorporated by reference (as stated therein) as part of this Quarterly Report on Form 10-Q.
#Filed herewith
+Indicates a management contract or compensatory plan or arrangement.
|
(1)
| |
Filed as an exhibit to Rigel’s Current Report on Form 8-K (No. 000-29889) filed on May 29, 2012, and incorporated herein by reference. |
|
(2)
| |
Filed as an exhibit to Rigel’s Current Report on Form 8-K (No. 000-29889) filed on May 18, 2018, and incorporated herein by reference. |
|
(3)
| |
Filed as an exhibit to Rigel’s Current Report on Form 8-K (No. 000-29889) filed on February 2, 2007, and incorporated herein by reference. |
|
(4)
| |
Filed as an exhibit to Rigel’s Registration Statement on Form S-1 (No. 333-45864), as amended, and incorporated herein by reference. |
|
(5)
| |
Filed as an exhibit to Rigel’s Current Report on Form 8-K (No. 000-29889) filed on June 24, 2003, and incorporated herein by reference. |
|
(6)
| |
Filed as an exhibit to Rigel’s Quarterly Report on Form 10-Q (No. 000-29889) for the quarter ended March 31, 2009, and incorporated herein by reference. |
SIGNATURES
Pursuant to the requirements of the Securities Exchange Act of 1934, as amended, the registrant has duly caused this report to be signed on its behalf by the undersigned, thereunto duly authorized.
|
|
|
|
|
|
|
|
RIGEL PHARMACEUTICALS, INC.
|
|
|
|
|
|
|
|
|
By:
|
/s/ RAUL R. RODRIGUEZ
|
|
|
|
|
Raul R. Rodriguez
|
|
|
|
|
Chief Executive Officer
(Principal Executive Officer)
|
|
|
|
|
|
|
|
|
|
|
|
|
|
Date:
|
May 5, 2020
|
|
|
|
|
|
|
|
|
By:
|
/s/ DEAN L. SCHORNO
|
|
|
|
|
Dean L. Schorno
|
|
|
|
|
Chief Financial Officer
(Principal Financial Officer)
|
|
|
|
|
|
|
|
|
|
|
|
|
|
Date:
|
May 5, 2020
|